Bitcoin’s drop from $29,000 in mid-August has significantly changed market dynamics. Despite the short-lived jump to $27,000 following the news about Grayscale’s win against the SEC, Bitcoin is still hovering around $25,700.
A deeper dive into on-chain metrics reveals that this downward pressure primarily comes from short-term holders offloading their assets.
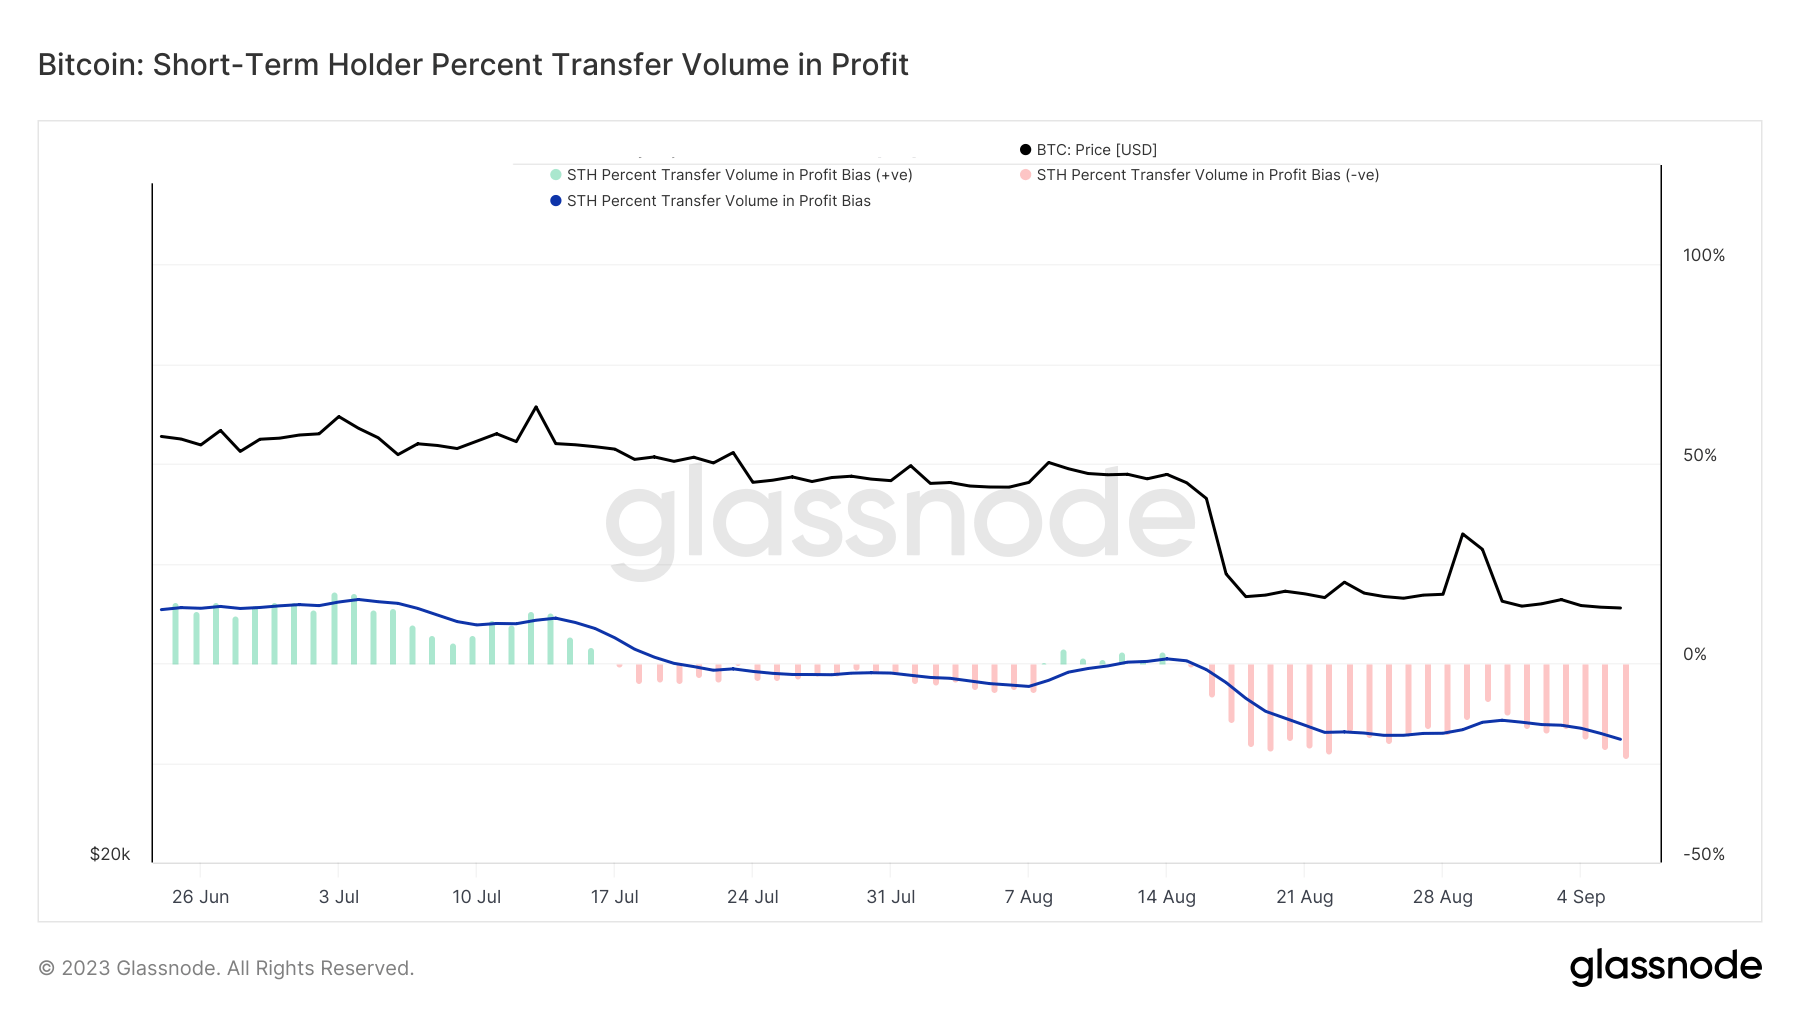
One of the most telling metrics in this scenario is the short-term holder percent transfer volume in profit. This metric offers insights into the bias of on-chain value settled by short-term holders, either in profit or loss.
A positive value indicates that over 50% of the short-term holder transfer volume is in profit, while a negative value suggests the opposite, signaling that more than half of the short-term holder transfer volume is in loss.
Data from Glassnode shows a dip in the STH transfer volume profit correlating with Bitcoin’s decline from $29,400. As of Sep. 6, the STH transfer volume bias stood at –23.5 %, indicating that a significant portion of the transfer volume from short-term holders was at a loss.

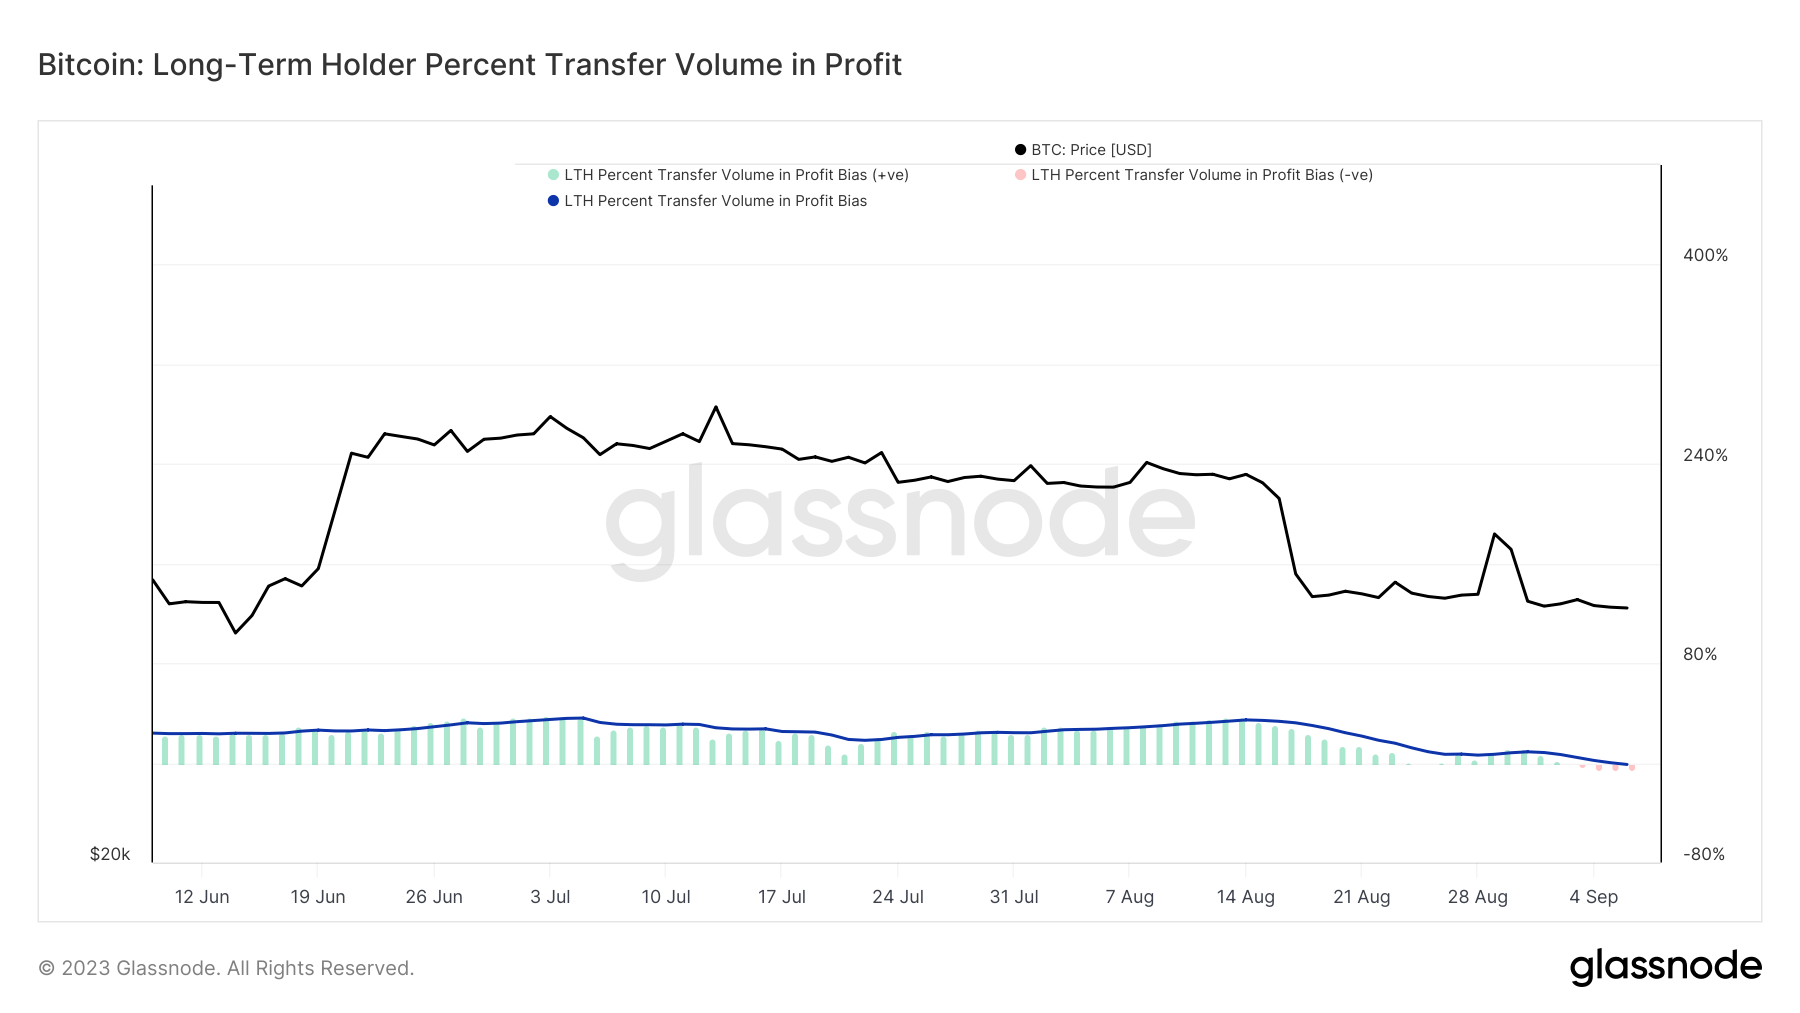
Contrastingly, long-term holders exhibit a more resilient stance. Their metrics began to show transfers in loss only as of Sep. 3. By Sep. 6, the long-term holder percent transfer volume bias was recorded at -5.5%, indicating that most long-term holders remain in profit despite the market’s recent turbulence.

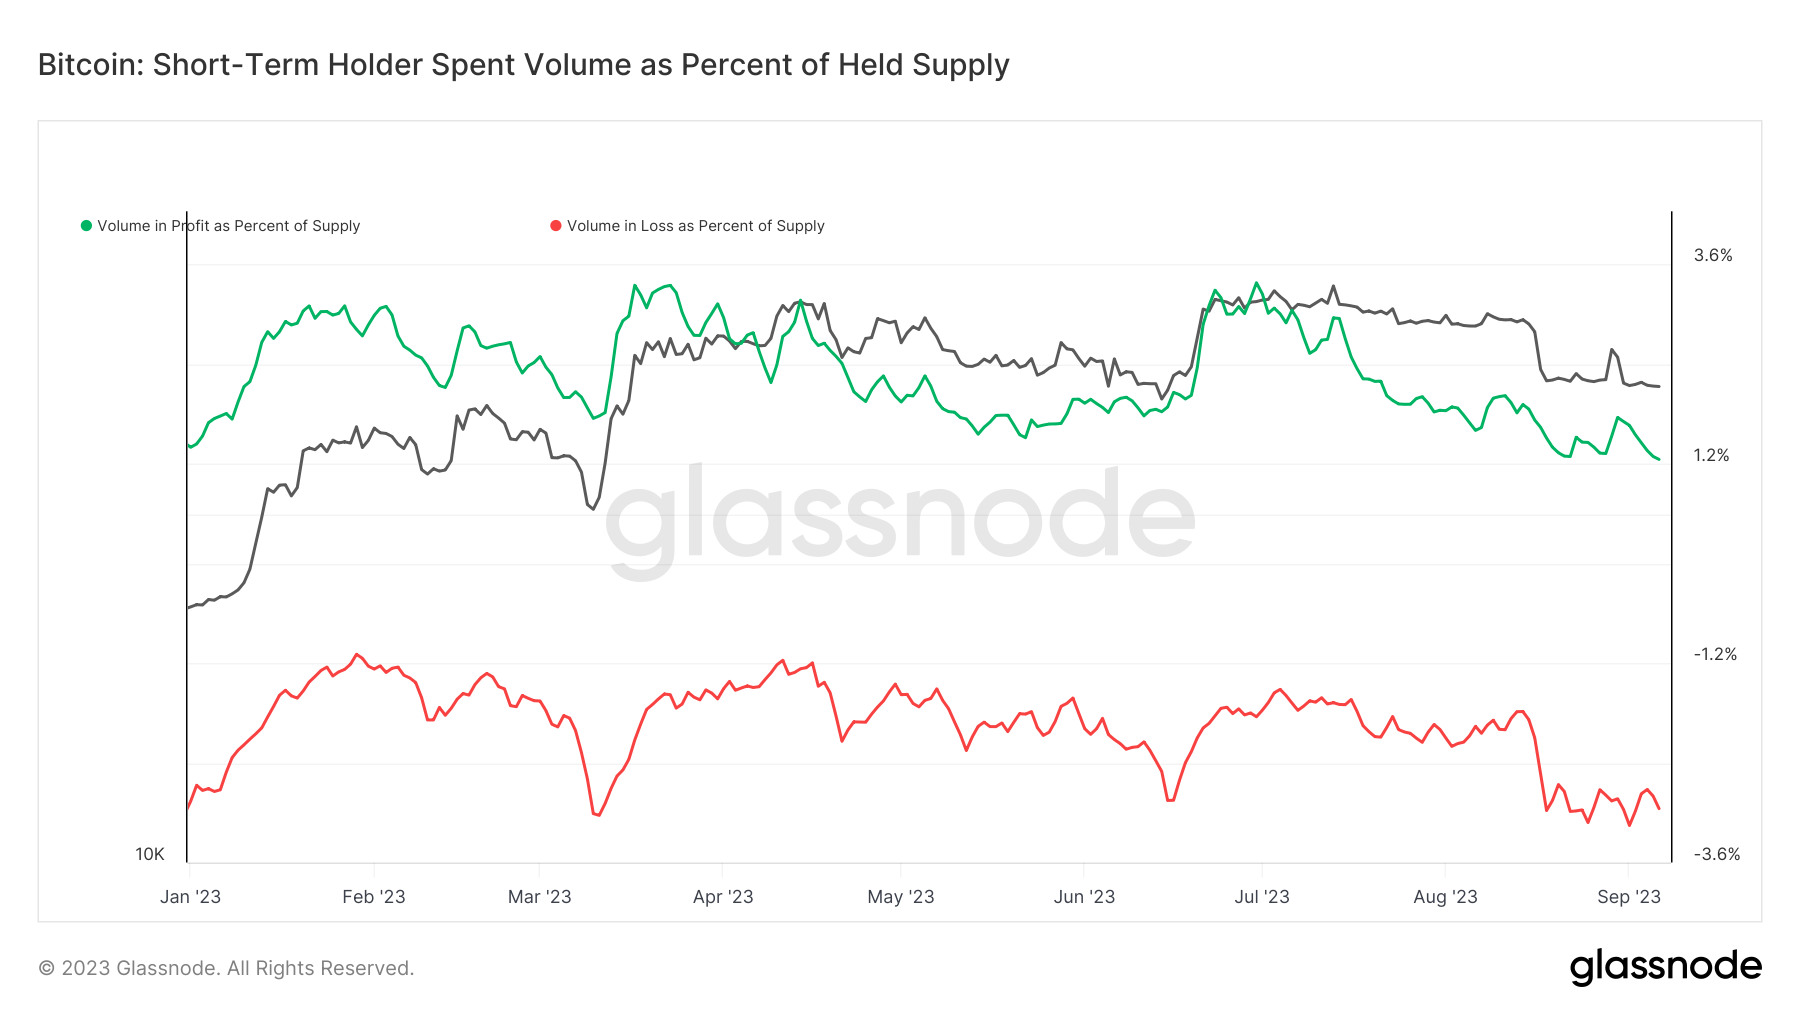
Another metric worth noting is the short-term holder spent volume as a percentage of held supply. This metric showcases the proportion of on-chain transfer volume by short-term holders relative to their total maintained supply. Historically, significant movements in this metric have been associated with high-volatility events. On Sept. 3, 3.1% of the total short-term holder supply transacted at a loss. The last time such a high percentage was observed was in mid-March, correlating with Bitcoin’s price plummeting from $23,000 to $20,000.

The heightened selling pressure from short-term holders could indicate a lack of confidence in Bitcoin’s short-term price trajectory. However, the resilience shown by long-term holders suggests a continued belief in Bitcoin’s long-term value.
The post Short-term holders bear the brunt of Bitcoin’s volatility appeared first on CryptoSlate.


