As Bitcoin’s short stint below $40,000 caused quite a stir in the market, one could expect that its recovery to $42,000 would have caused a spike in retail trading activity. With short-term holders making up the majority of what we call “retail” traders, a quick jump in Bitcoin’s price would usually cause a notable spike in activity among the cohort.
According to data from Glassnode, exchange deposit and withdrawal volumes crossed $8 billion on Jan. 30. While this is lower than the 31-month high of $11.86 billion recorded on Jan. 12, it still represents significantly high volumes for this part of the market cycle.
The 30-day simple moving average (SMA) of exchange volume reached $5.65 billion on Jan. 30 — levels previously seen during the 2021 bull market when Bitcoin’s price hovered between $60,000 and $64,000.
Diving deeper into on-chain data allows us to understand better where the volume is coming from.
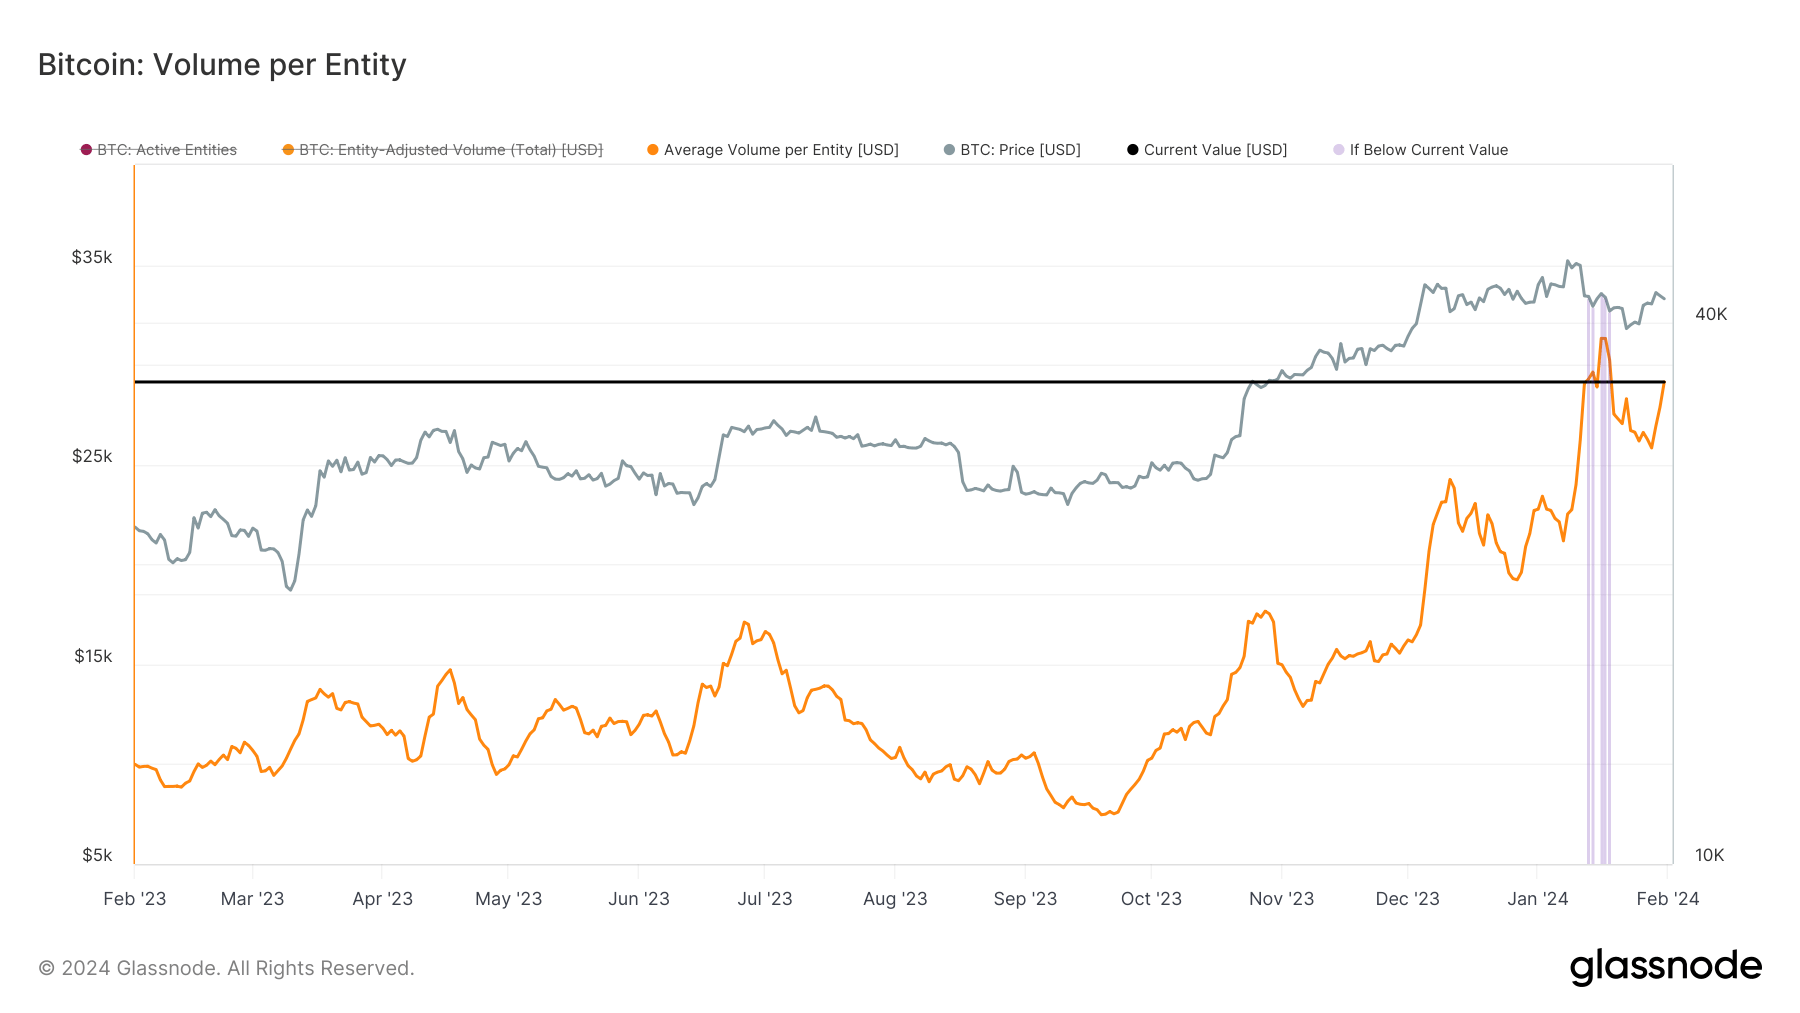
Glassnode’s data showed a growing number of large entities in the market. Its data tracks the entity-adjusted volume of Bitcoin transactions and divides it by the number of active entities on the Bitcoin network to get an average volume per active entity.
The declining number of active entities in the market has led to a significant spike in the average volume per entity since September 2023, peaking at $31,318 on Jan. 16. As of Jan. 31, the average volume per entity stands at $29,136.

Whales, addresses holding over 1,000 BTC, have also seen a burst of activity this year, with transfer volumes to exchanges significantly higher than last year’s average volumes. Whale deposits to exchanges peaked on Jan. 12 with 79,228 BTC, a day after ETF trading began in the U.S. On Jan. 31, whales deposited 43,556 BTC to exchanges.
The growing spot Bitcoin ETF volume and inflows in the U.S. certainly added to this increase in average volume, as the creation and redemption mechanism for ETF contracts relies on large transactions from APs.
This shows a growing presence of large players in the space, with institutions and whales at the helm.
The post Whales and institutions lead the charge in Bitcoin’s exchange volume surge appeared first on CryptoSlate.


