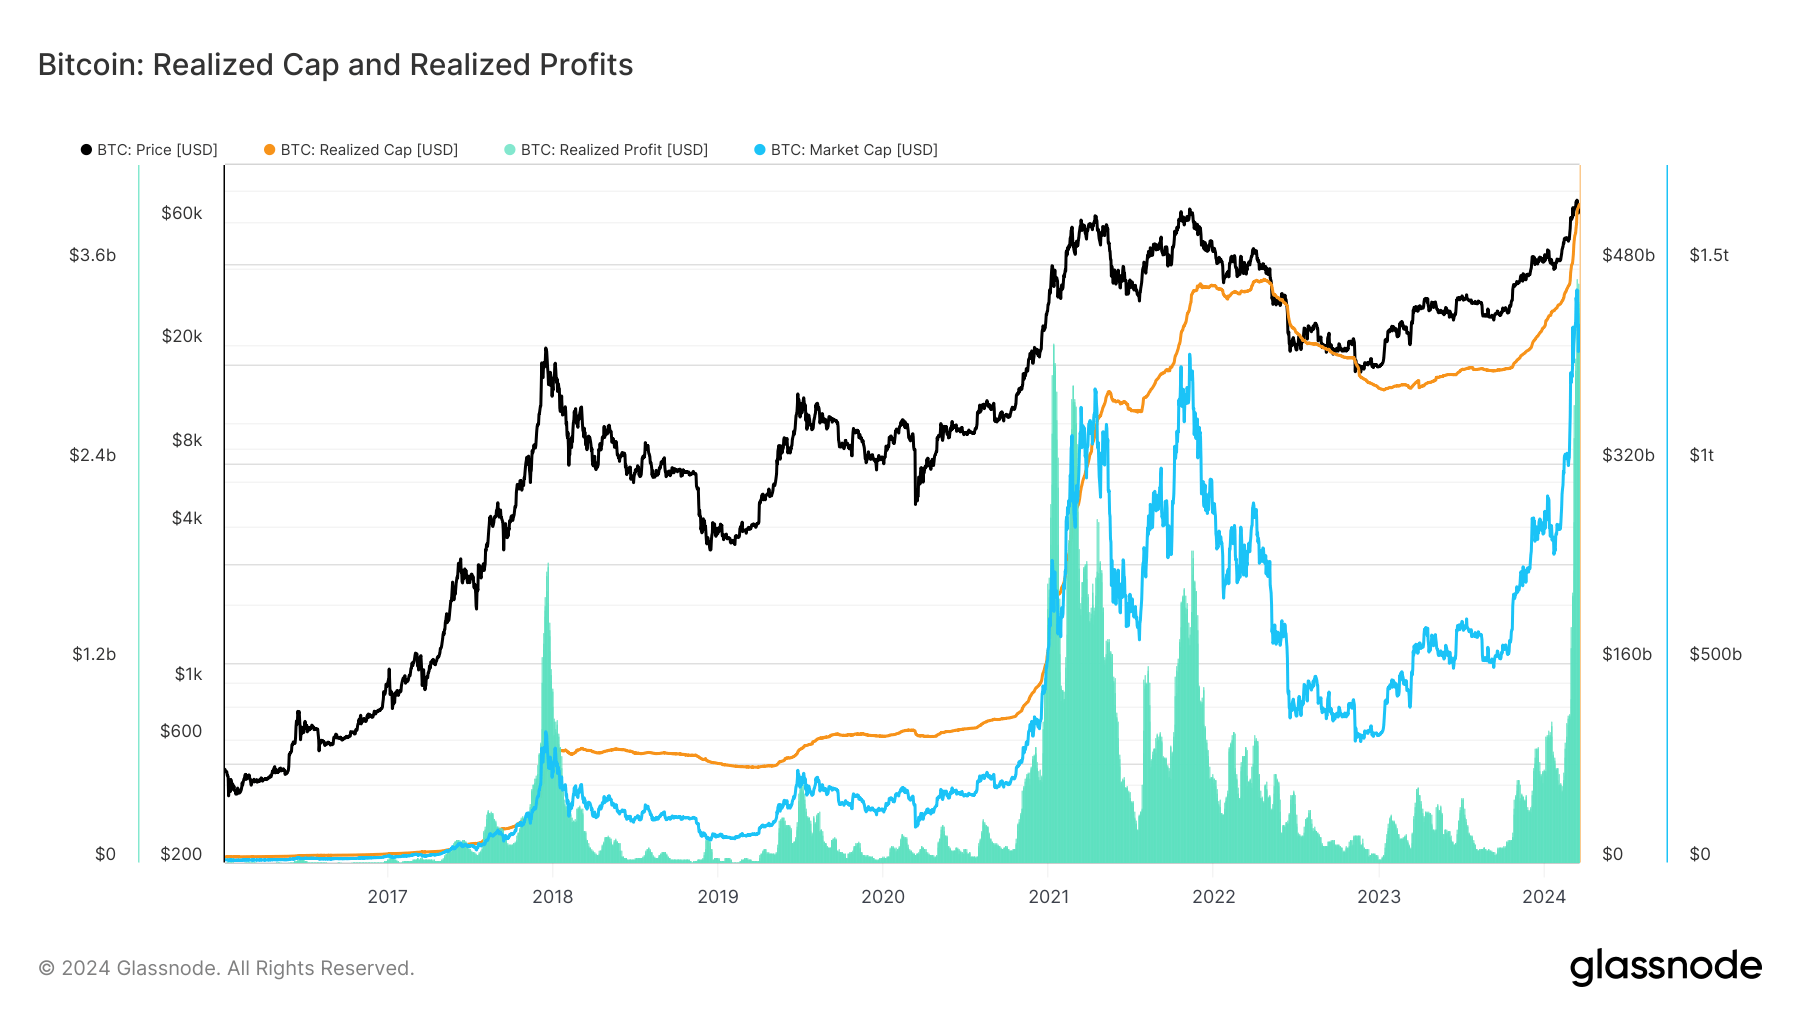
Realized profit represents the cumulative profit of all Bitcoins moved on-chain, calculated as the difference between the acquisition and movement prices. It’s a direct measure of the profitability for Bitcoin holders, indicating when investors are likely to sell and take profits.
On the other hand, the realized cap offers a more accurate representation of the market’s valuation than the traditional market cap. It calculates Bitcoin’s capitalization by valuing each unit at the price when it was last moved rather than the current price. This metric shows the market’s aggregate cost basis, revealing the average acquisition price of all Bitcoins.
These metrics are critical for understanding the depth of market activity, investor sentiment, and the true economic weight behind price movements.
Since the beginning of the year, Bitcoin’s realized profit has been rising steadily, and a massive spike began in March. Realized profit peaked at $3.51 billion on Mar. 13, reaching its all-time high. This spike in RP came as Bitcoin broke its ATH and traded at just above $73,100 for the day.
It was only a matter of time before a high profit-taking level occurred in the market. The second-highest realized profit was $3.130 billion, recorded on Jan. 10, 2021. Bitcoin’s price volatility in the following days was most likely a result of investors capitalizing on the price surge — the decline to $3.31 billion in realized profit by Mar. 18 suggests a normalization following the sell-off.

It’s hard to pinpoint what prevented Bitcoin from slipping below further $65,000 on Mar. 16. While some metrics show solid support was formed at that level, it’s also likely that the continuous accumulation played a significant part in absorbing much of that selling pressure.
This is seen in the consistent growth of Bitcoin’s realized cap, which increased from $429.97 billion at the beginning of the year to $528.32 billion on Mar. 18. This stable growth contrasts with the changes in the more volatile market cap, indicating ongoing accumulation despite price fluctuations. The steady increase in the realized cap, even during price corrections, shows a robust confidence in Bitcoin that seems to have established a solid foundation for further growth.
This data highlights the market’s resilience, showing that despite short-term speculative pressures, the underlying trend is one of sustained accumulation and confidence. The divergence between the realized cap’s steady ascent and the market cap’s volatility highlights a maturing market where long-term accumulation strategies still manage to prevail over short-term speculation.
The post Bitcoin’s realized profit hits ATH but market keeps accumulating appeared first on CryptoSlate.


