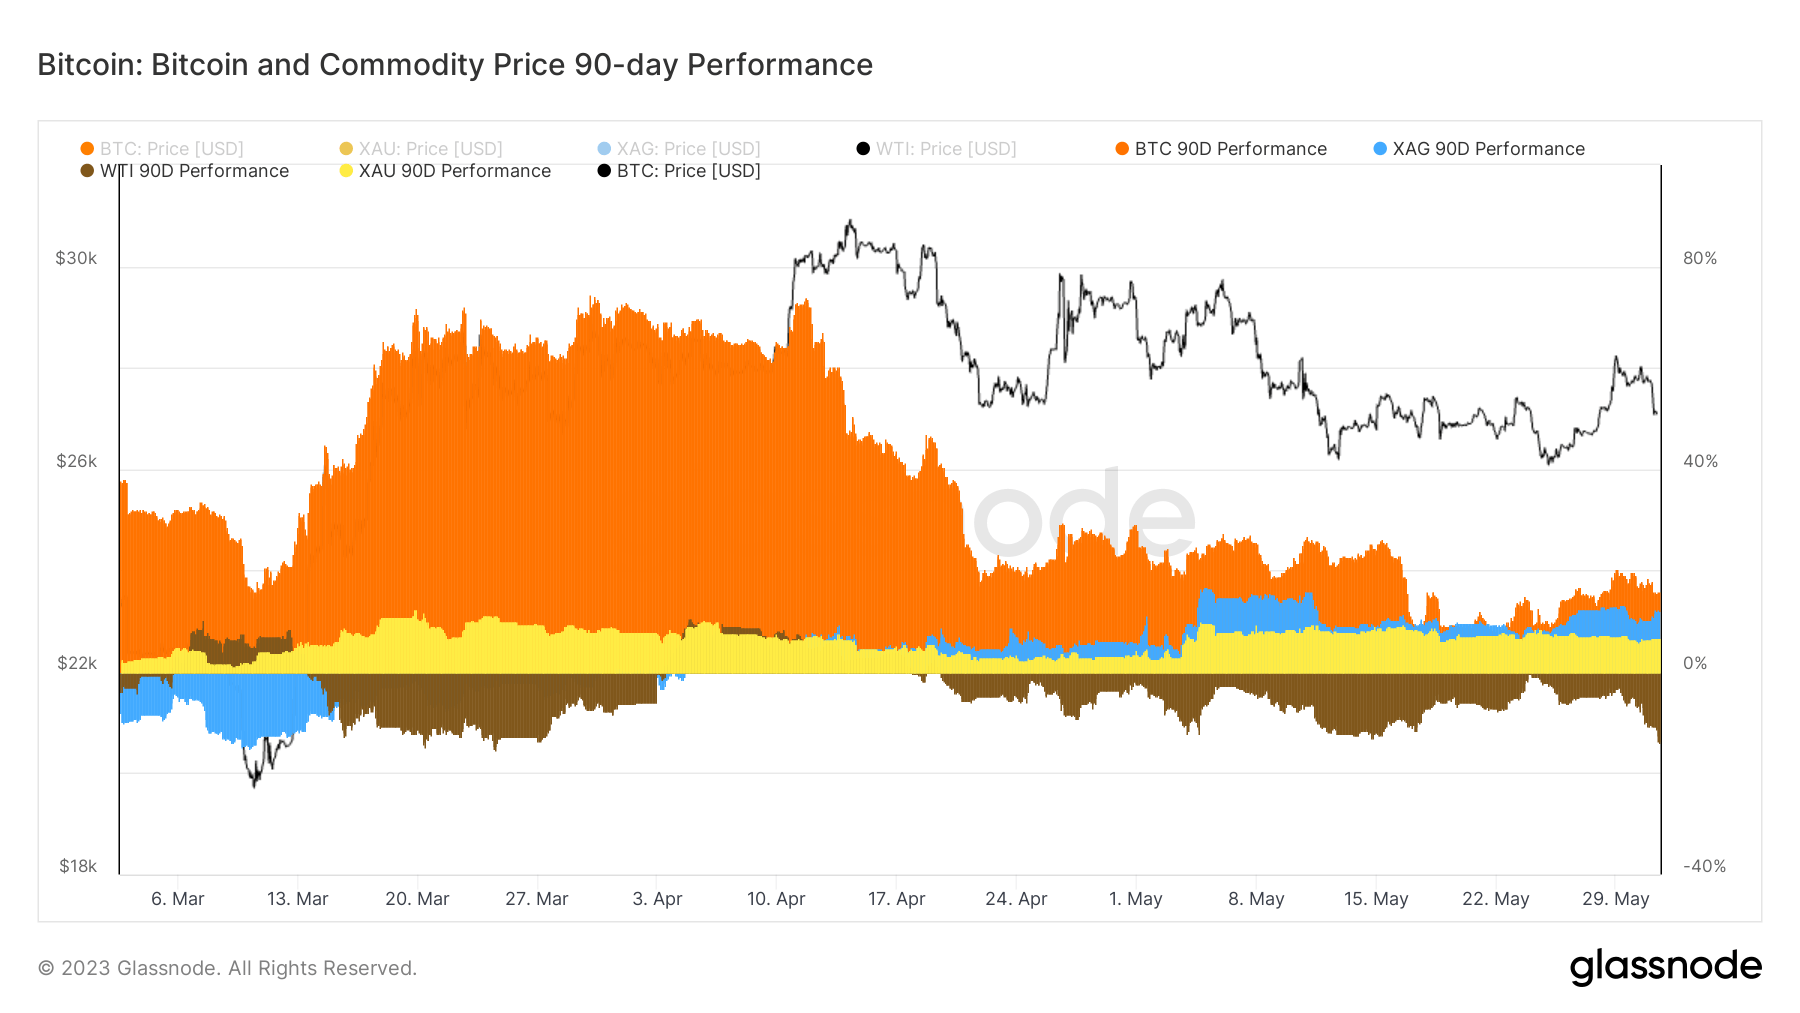
Despite the broader market crisis induced by the U.S. debt ceiling issue, Bitcoin and commodities, particularly gold and silver, have demonstrated notable performance since the start of 2023.
Over the last 90 days, Bitcoin has recorded a 15.85% increase, outperforming silver’s 12.41% rise and gold’s 6.82% gain.

However, the observed slow and steady returns of Bitcoin should not be misconstrued as an indicator of an impending stable market.
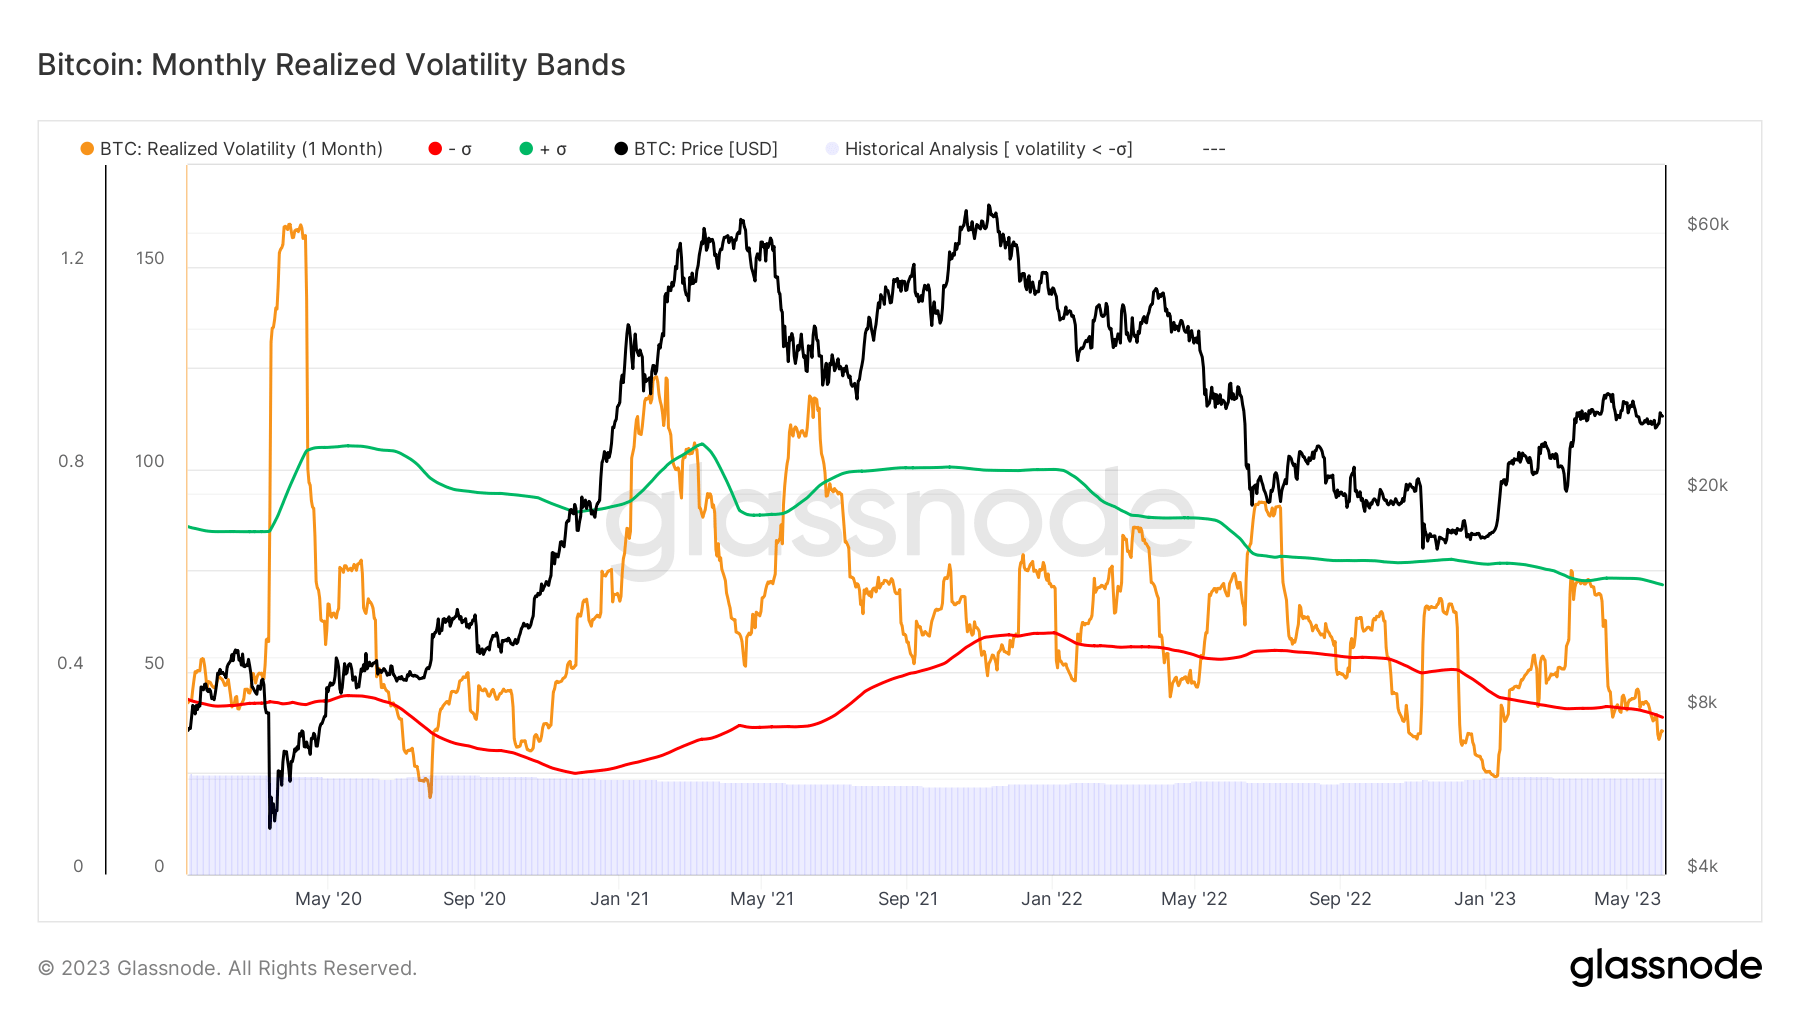
Bitcoin’s monthly realized volatility, a metric reflecting the degree of variation or dispersion of an asset’s returns over a month, has dropped to 34.1%, slipping below the lower limit of the 1-standard deviation Bollinger Band.
Bollinger Bands are a technical analysis tool that plots a set range around an asset’s price, with wider bands indicating higher volatility and vice versa. A drop below the lower band may signal an upcoming correction or reversal.

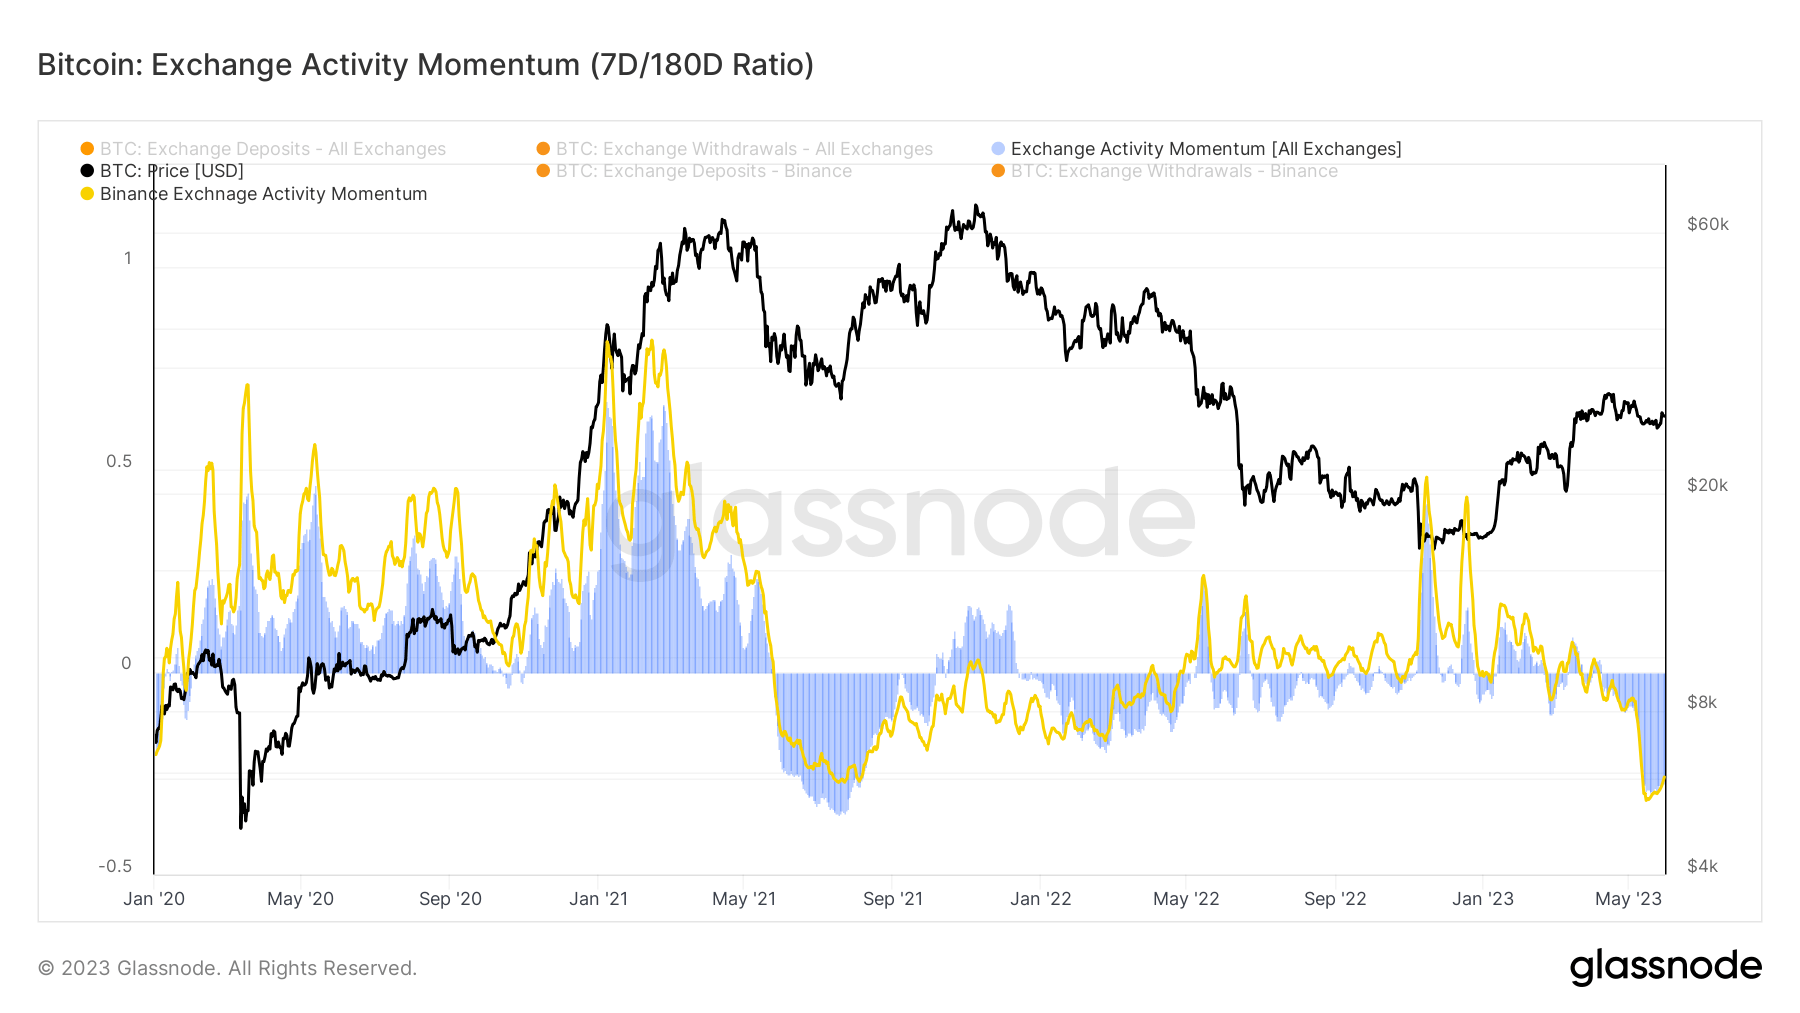
The slowing down of Bitcoin’s market activity is further substantiated by the momentum seen in exchange activity. Glassnode calculates this metric by comparing the current week’s average number of exchange deposit/withdrawal transactions to the median of such transactions over the preceding six months, creating an activity ratio.
A recent 27.3% reduction in this ratio, compared to the last six months, verifies the trend of diminishing market participation.

These two factors – low investor activity and decreased monthly realized volatility – paint a picture of a dormant, flat market. However, according to Glassnode, such low-volatility periods constitute only 19.3% of Bitcoin’s market history, suggesting a strong probability of an incoming volatility surge.
The post Bitcoin outperforms commodities as market gears up for high volatility appeared first on CryptoSlate.


