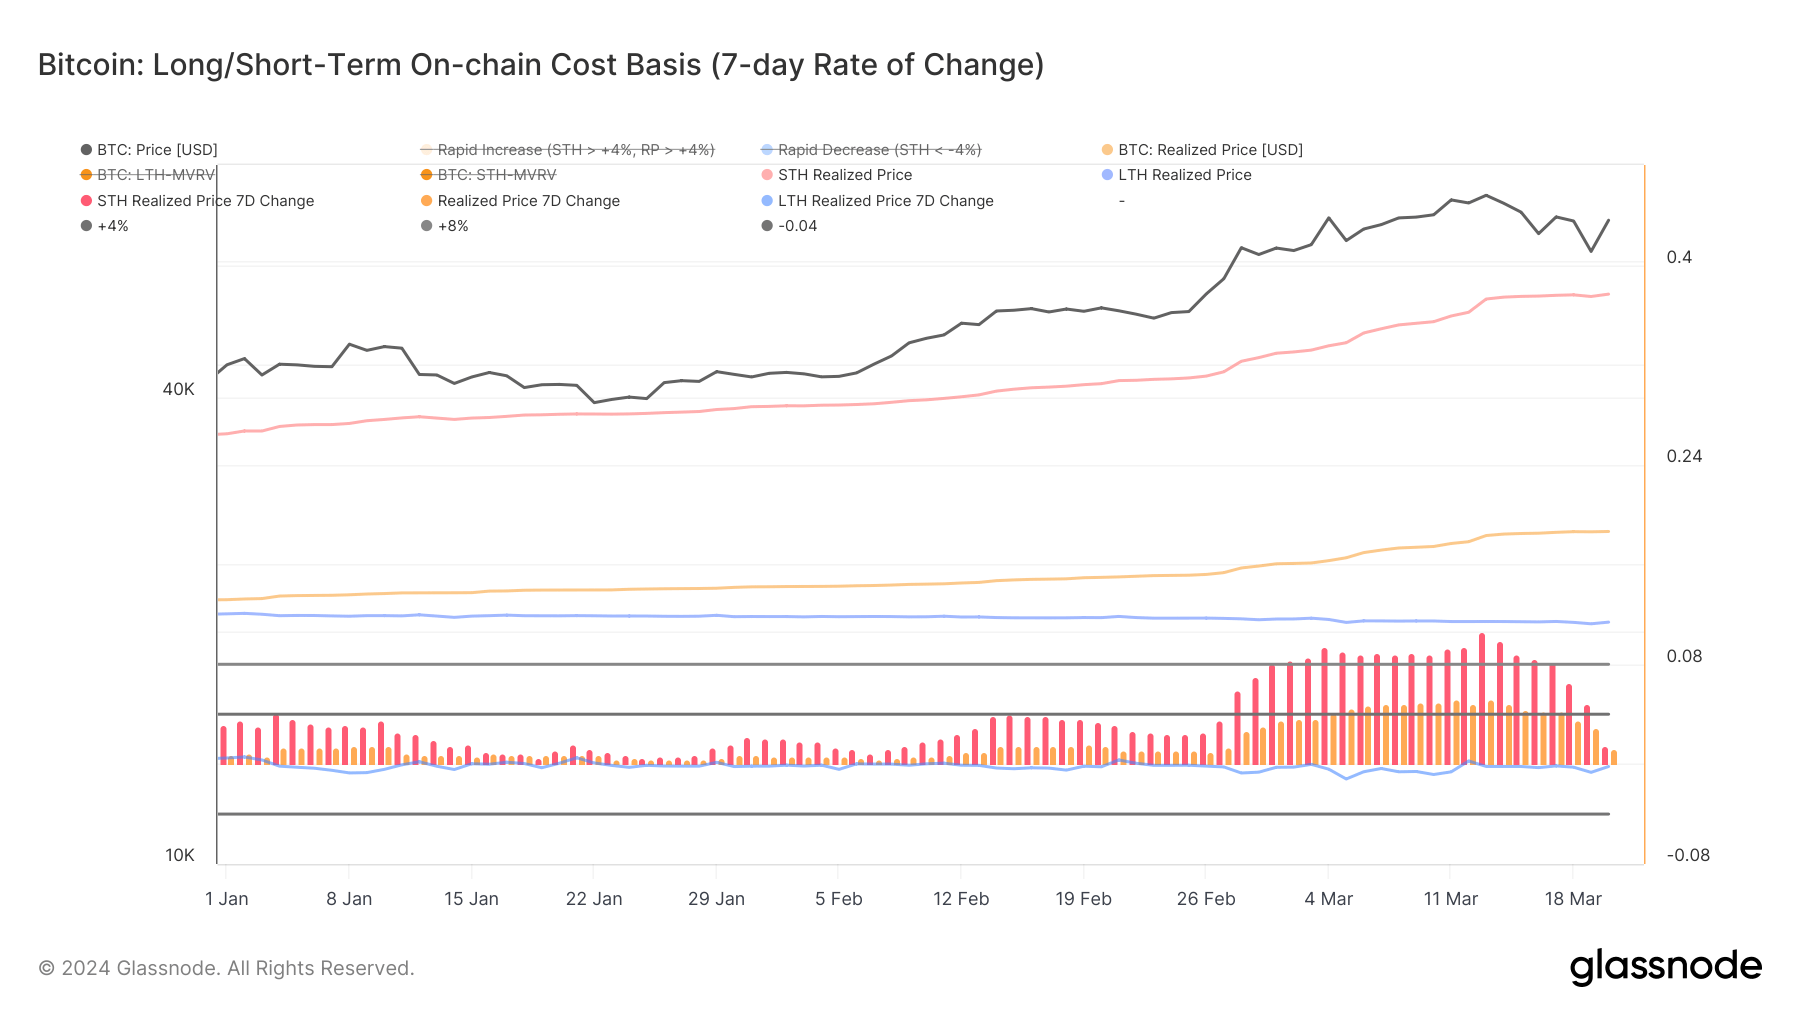
The realized Bitcoin price represents the average on-chain acquisition cost. It’s a handy metric as it perfectly gauges the market’s valuation baseline at any given point. When dissected through the lens of short-term and long-term holders, it provides insights into the cohorts’ investment horizons and their acute effect on Bitcoin’s price.
These cohorts’ 7-day change in realized price provides a much better metric visualization. The 7-day change in realized price for short-term holders reached its three-year high on Mar. 13, at 10.62%. The 7-day change in realized price for long-term holders the same day stood at -0.183%, representing a slight decrease from the previous weeks.
This divergence between STH and LTH realized prices suggests a robust influx of short-term speculative interest into the market. New market participants were entering at higher price levels than long-term holders between Mar. 6 and Mar. 13, driving the cohort’s realized price up. The rise in STH realized price culminating on Mar. 13, when Bitcoin’s price peaked at above $73,100, implies that significant investments have been made at or near peak prices.

Tracking changes in realized prices for both LTHs and STHs is vital because of their ability to show shifts in market sentiment and potential pressure points. For instance, a rising STH realized price, particularly with Bitcoin’s price increase, can signal growing optimism or speculative demand as newer entrants are willing to invest at higher price levels. The relatively stable or decreasing LTH realized price change suggests a hold sentiment among long-term investors, who may not move their holdings despite price fluctuations, thus anchoring the market’s foundational perception of value.
The data from Glassnode showed a market at a potential inflection point. The dramatic increase in STH realized price change, alongside a significant increase in Bitcoin’s price, indicated a short-term bullish sentiment driven by speculative trading and new entrants attracted by the momentum. However, spikes as sharp as the one seen on Mar. 13 rarely last longer than a couple of weeks before experiencing a significant correction, which is precisely what happened in the past week.
The 7-day change in short-term holder realized price dropped by 1.469% by Mar. 20, following Bitcoin’s decrease to $61,000 and a subsequent recovery to $68,000. This sharp drop shows that the speculative enthusiasm cooled down, and the market entered a consolidation phase. Data indicates that the buying momentum and optimism that drove the significant increase in STH realized price and, by extension, Bitcoin’s price has tempered, leading to a more cautious market sentiment.
Several interpretations can be drawn from this data point. Firstly, the reduction in the rate of change in STH realized price could indicate that the influx of new capital at higher valuation levels has slowed. The simultaneous decrease in both the STH realized price change and Bitcoin’s market price can also suggest a reduction in sell-side pressure from short-term holders.
Typically, a high STH realized price change, especially when it sets a record as it did on Mar. 13, could indicate a heightened likelihood of selling activity as short-term holders look to capitalize on gains. However, as this pressure subsides, it can stabilize prices, albeit at a level lower than the recent highs, as the market absorbs the effects of previous speculative trading.
Looking ahead, this period of recalibration could pave the way for resistance to be created at this price level, as it allows the market to digest recent gains. Moreover, the behavior of long-term holders will continue to be a critical factor to monitor, as their steadiness amidst volatility often serves as an anchor for the market’s stability.


