The crypto market offers a unique perspective on asset valuation through the concept of realized capitalization. For Bitcoin, the realized cap provides invaluable insight into its economic footprint and investor sentiment.
Traditionally, market capitalization is calculated by multiplying the current market price of an asset by its total circulating supply. While this method offers a quick overview of Bitcoin’s market value, it doesn’t always present an accurate picture. Many coins may be inactive or lost, and a significant number could be held by long-term investors, all contributing to a disparity between the theoretical market cap and the actual economic value in circulation.
The realized cap addresses this discrepancy. It values each unit of Bitcoin based on the price at which it was last transacted rather than the current market price. This approach offers a more granular and realistic view of the market’s economic health.
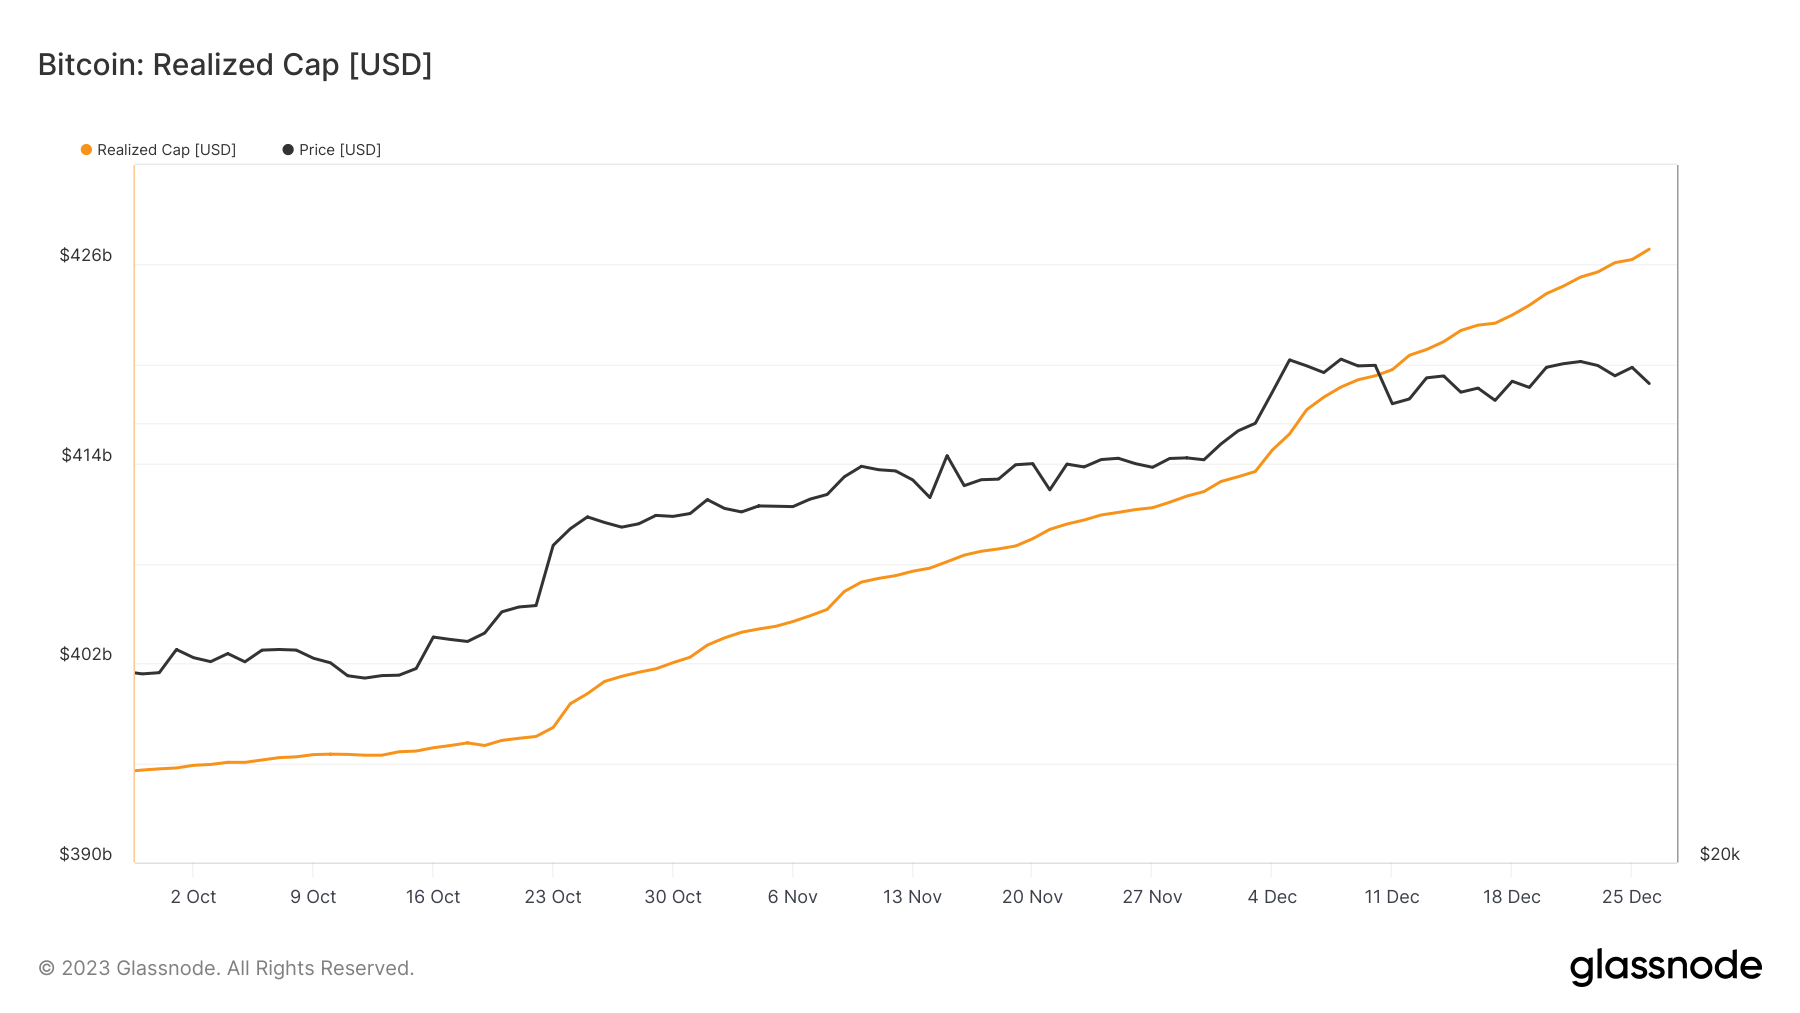
In 2023, Bitcoin’s realized cap increased from $380.62 billion at the beginning of the year to $426.93 billion on Dec. 26, marking a significant 12.15% increase.
This upward trajectory was particularly evident in the latter part of the year. Between Oct. 22, when the realized cap was $397.59 billion, and Dec. 26, the realized cap rose by 7.37%. This increase aligns with a rally in Bitcoin’s price, surpassing $30,000 and reaching yearly highs of around $42,500.

The significant increase in Bitcoin’s price has spurred heightened trading activity, reflected in increased capital inflows and dynamic shifts in the market.
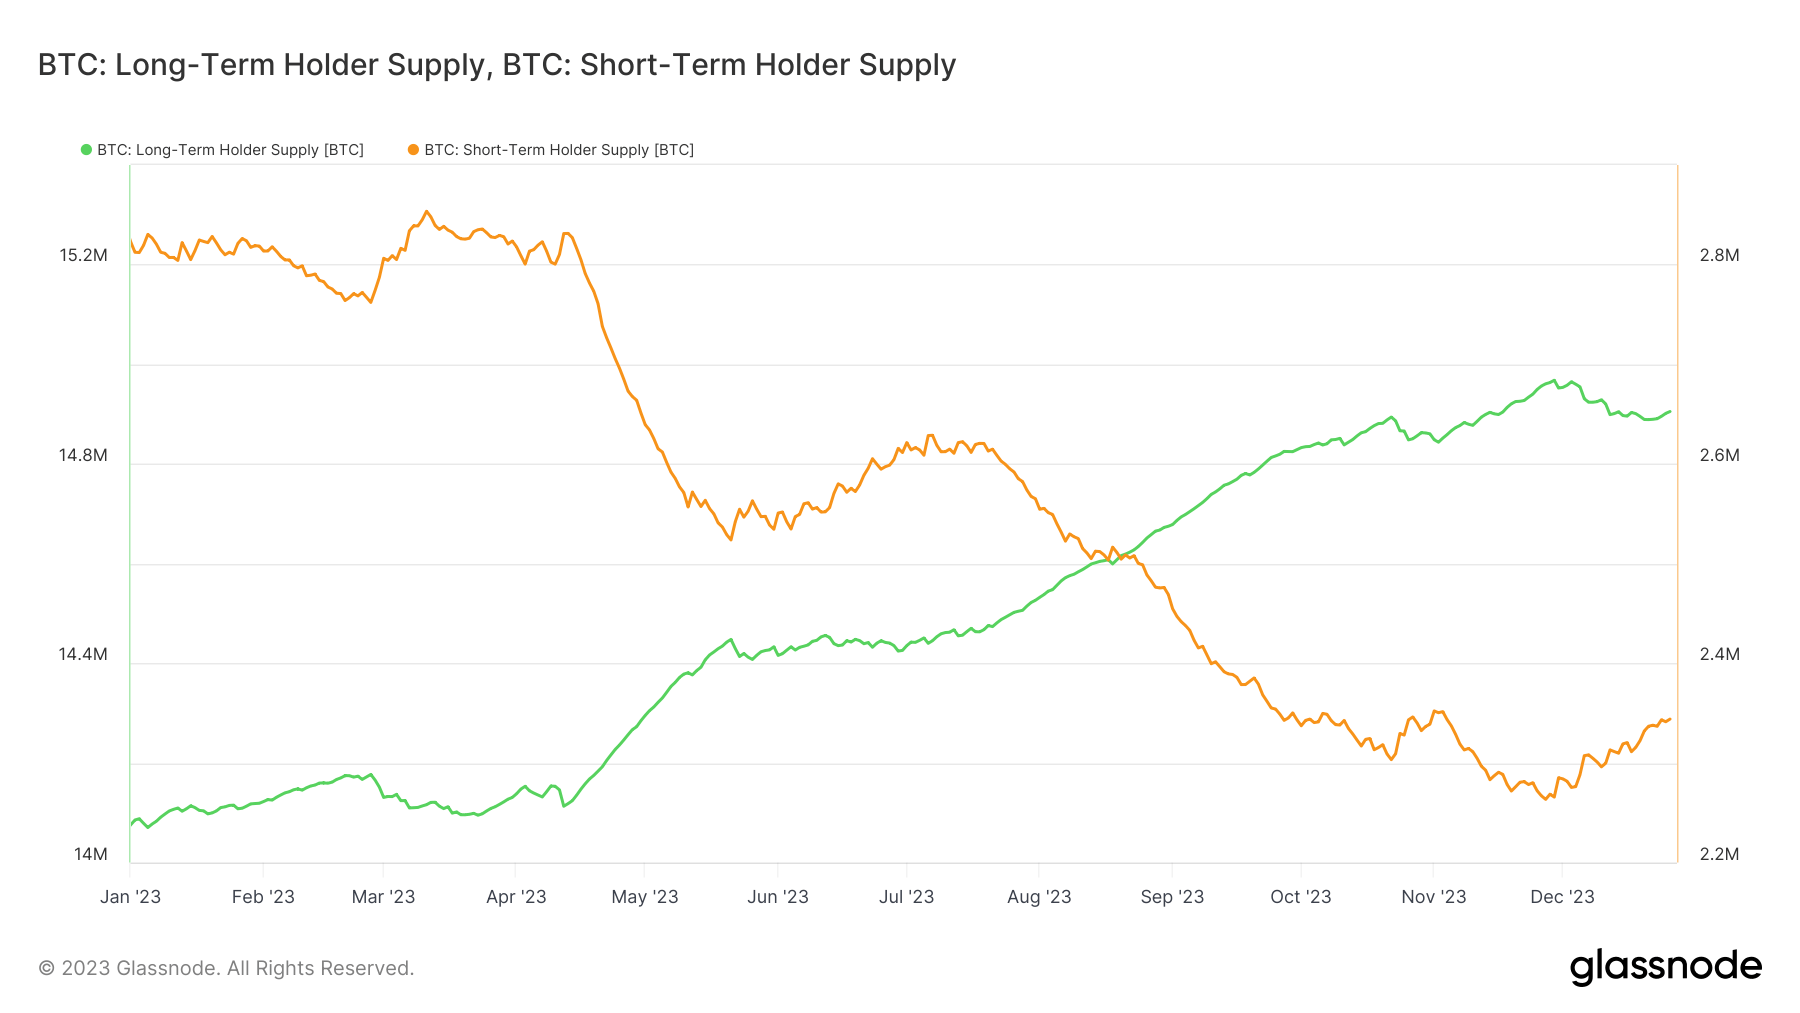
The distribution of Bitcoin holdings among short-term and long-term holders provides additional context. A decrease in the supply held by short-term holders suggests a transition towards a market dominated by long-term investors. These individuals have held Bitcoin for over 155 days and are increasingly contributing to the asset’s capital influx.
The rise in Bitcoin’s realized cap and the changing holder composition have several implications for the market. Primarily, the increase in realized cap suggests a growing economic relevance of Bitcoin, with a more substantial amount of capital being invested over time. This shift indicates a maturation of Bitcoin as an investment vehicle, reflecting broader acceptance and stabilization in the market.

Furthermore, the predominance of long-term holders indicates a bullish sentiment among investors, signaling a belief in Bitcoin’s long-term value proposition. This trend could potentially lead to reduced market volatility, as long-term holders are less likely to sell in response to short-term price fluctuations.
The post Bitcoin’s realized cap shows growing economic footprint appeared first on CryptoSlate.


