The distribution of Bitcoin’s supply across various cohorts — shrimps, crabs, fish, sharks, and whales — can help us understand how each market segment behaves. Shifts in Bitcoin’s supply among these groups are heavily correlated with price movements and broader market trends, which is why understanding them is essential when analyzing the market.
Shrimps represent retail investors holding less than 1 BTC, a measure of grassroots participation in the Bitcoin market. Crabs encompass retail-sized investors with holdings between 1 and 10 BTC, often regarded as informed, long-term holders.
Fish to sharks include higher-net-worth individuals and institutional investors with holdings ranging from 10 to 1,000 BTC, a category that reflects both early adopters and professional trading operations.
Lastly, whales hold between 1,000 and 10,000 BTC, whose movements are closely watched due to their significant market impact.
Tracking the supply distribution changes across these cohorts provides invaluable insights into Bitcoin’s liquidity and strategic positioning of different investor classes.
From Jan. 1 to March 13, shrimps have increased their Bitcoin holdings from 1.335 million BTC to 1.368 million. This consistent growth, despite price volatility, suggests a dollar-cost averaging strategy, where small, regular purchases are made regardless of the asset’s price.
This behavior indicates a deep-rooted belief in Bitcoin’s long-term value among retail investors, seen through their continued investment despite market uncertainties.
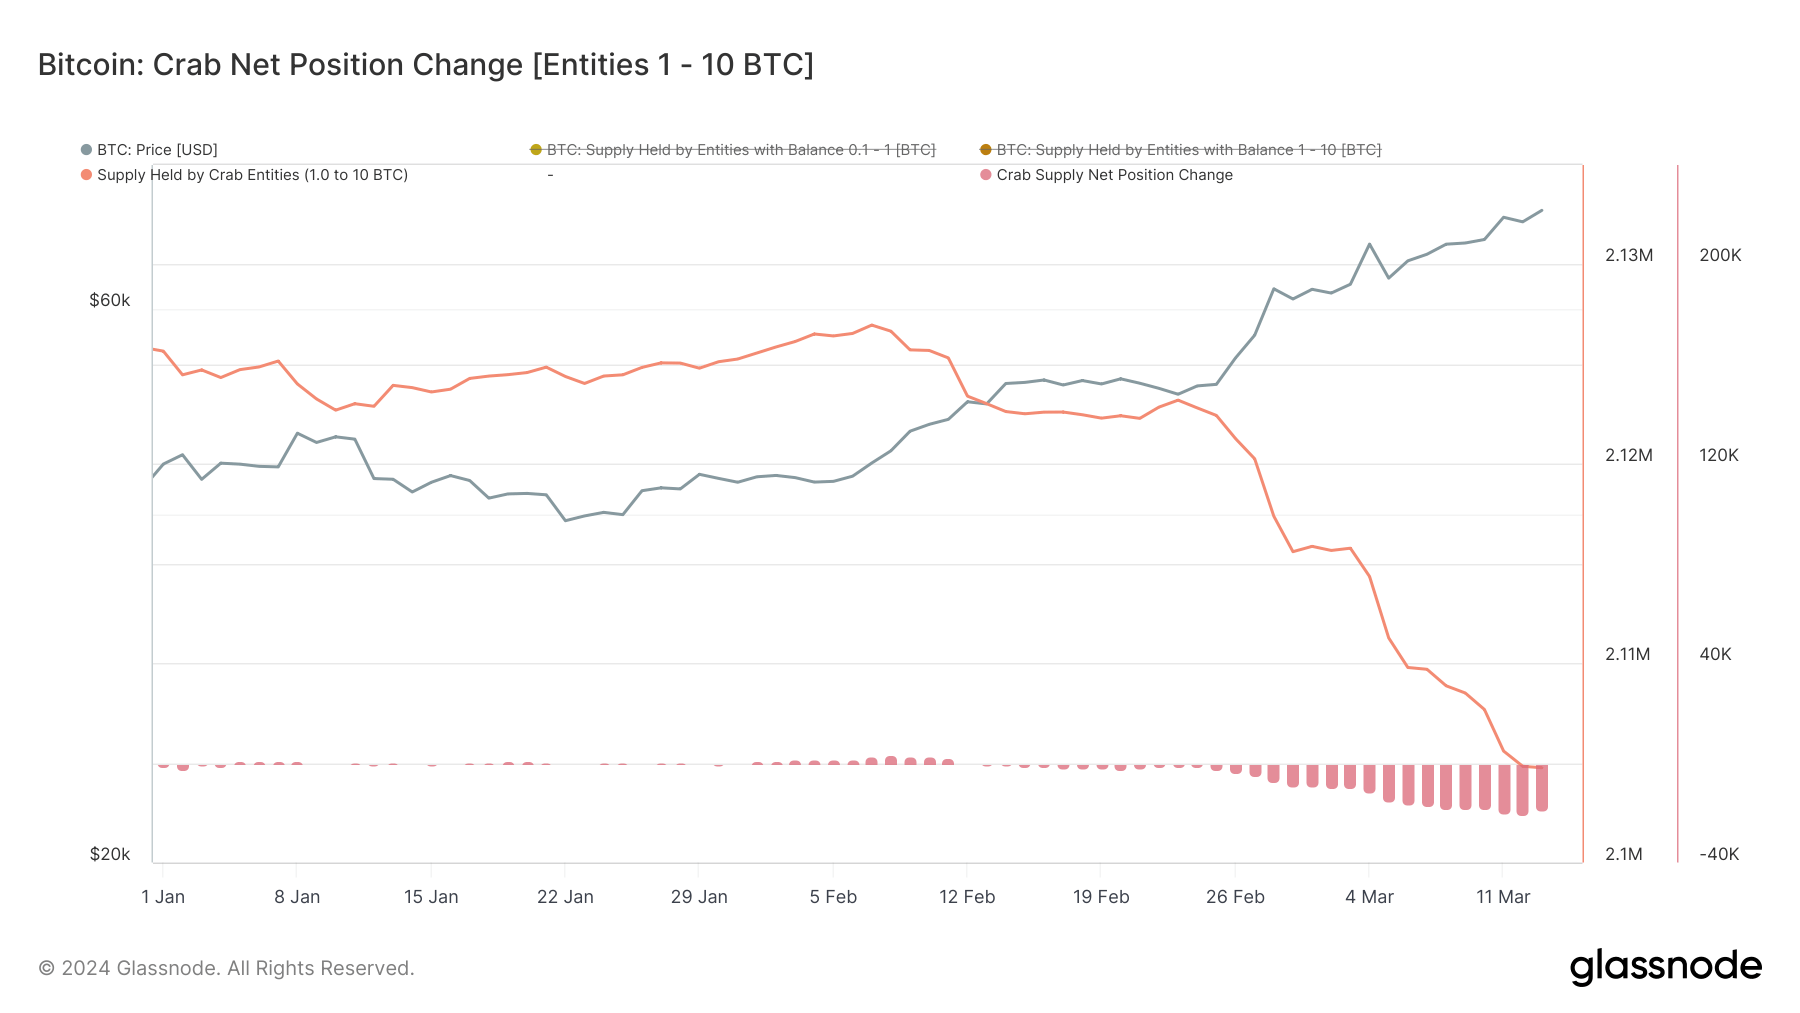
The crab cohort — typically retail investors with more substantial capital or those who have been accumulating over time — saw their holdings slightly decrease from 2.125 million BTC to 2.104 million BTC.
The reduction, notably around March 12, shows a reaction to price volatility, possibly taking profits or minimizing losses. It suggests that while crabs are committed to their Bitcoin investments, they remain sensitive to market fluctuations, ready to adjust their positions in response to perceived risks.

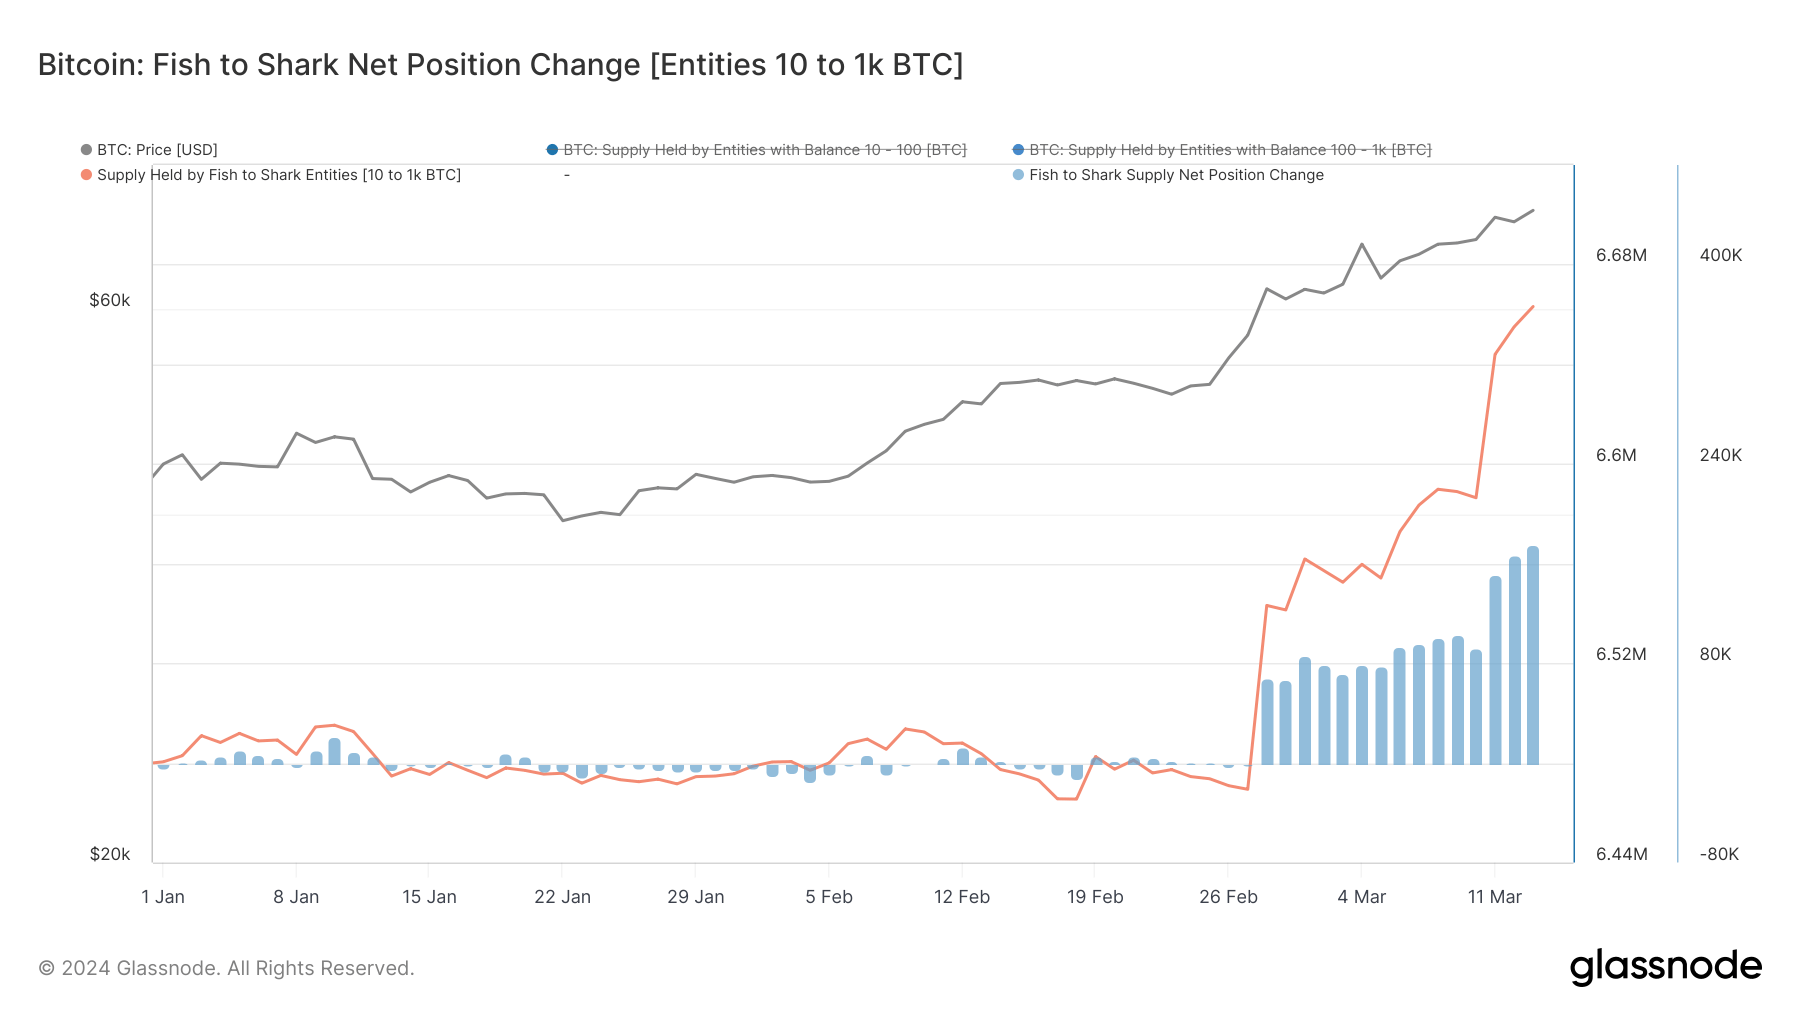
The fish-to-shark cohort saw an increase in holdings from 6.480 million BTC on Jan. 1 to 6.663 million BTC by March 13, with a significant positive change during the month.
This indicates strategic accumulation by higher-net-worth individuals and institutions, possibly leveraging the spot Bitcoin ETFs’ introduction and anticipated market growth. This group’s behavior reflects the actions of financially significant players whose confidence can sway the market.

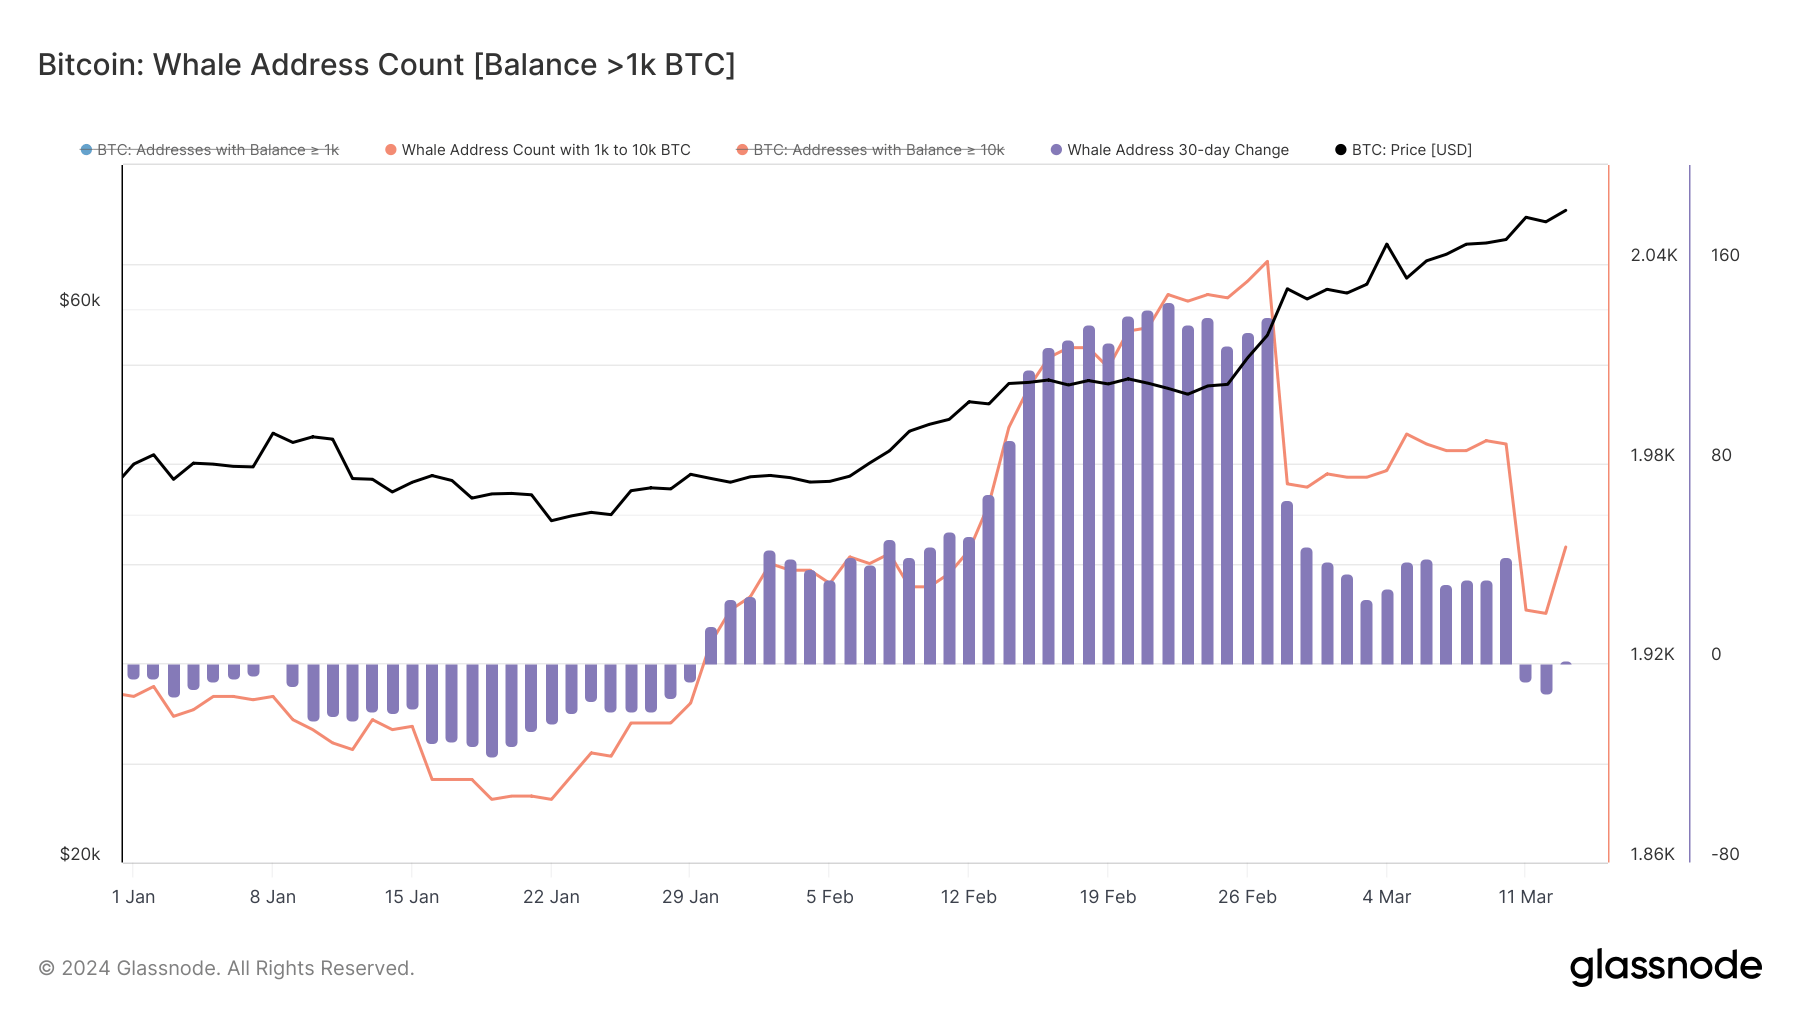
Whale entities saw their numbers fluctuate, peaking at 2,041 in February before dropping to 1,955 by March 13. This change suggests profit-taking or portfolio adjustments in light of the bullish market trend.
Whales’ movements are crucial to market direction, given their significant holdings and the influence they wield on market liquidity and sentiment.

Data from Glassnode showed distinct strategies across these cohorts, showing their varying perceptions of risk, investment horizon, and response to market movements.
Surprisingly, shrimps demonstrated unwavering belief in Bitcoin, persistently increasing their holdings. Meanwhile, Crabs, who are generally steady, showed a readiness to react to market signals, adjusting the size of their positions in response to price movements.
Fish and sharks seem to have been the cohort that capitalized the most on the launch of spot ETFs in the US. The market optimism that followed the long-awaited trading product significantly altered the size of the supply held by these cohorts, showing the growing confidence institutions and high-net-worth individuals have in Bitcoin.
Meanwhile, whales showed characteristic strategic flexibility, with the slight decrease in their numbers pointing to a careful approach in a bullish scenario.
The post From shrimps to whales: Who’s buying and selling during this rally? appeared first on CryptoSlate.


