
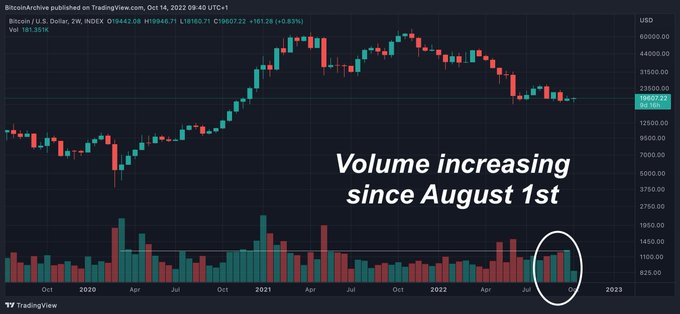
Bitcoin Archive tweeted that BTC volume is “climbing to bull market levels,” while highlighting a continuous monthly uptick since August.
That in itself cannot be taken as a definitive sign of the bull market returning. Nonetheless, in conjunction with Bitcoin’s Consumer Price Index (CPI) snap back on Thursday, a degree of hopium exists.
Bitcoin snaps back
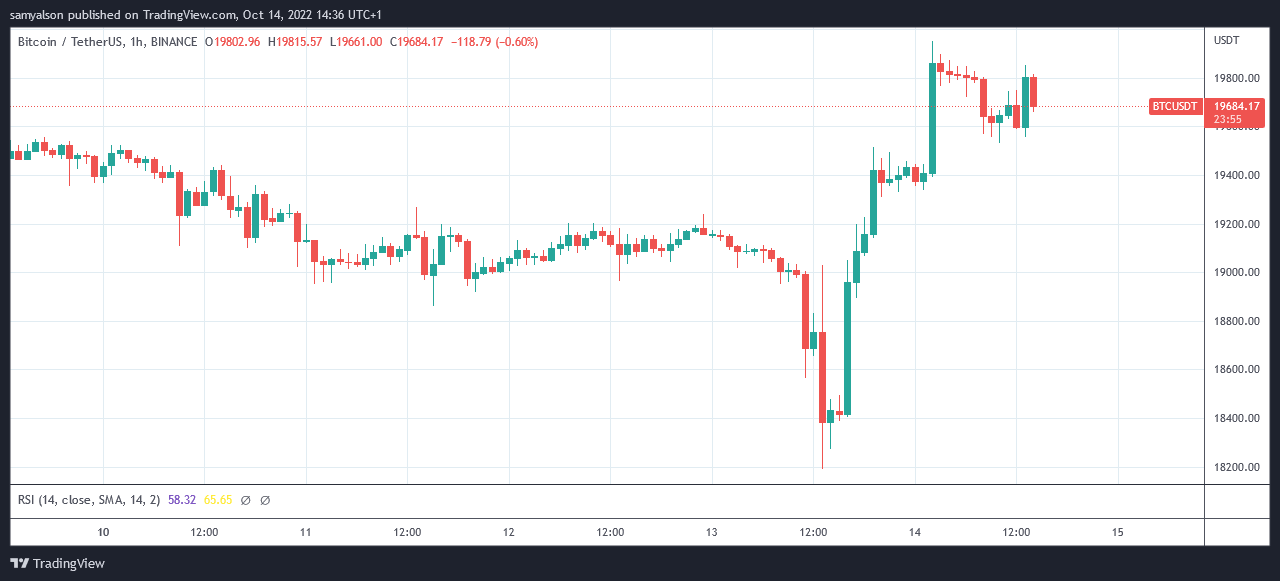
On October 13, the U.S. Bureau of Labor Statistics (BLS) released September’s CPI data showing consumer price inflation at an overall rate of 8.2% year-over-year.
The figure came in higher than expected, leading some to conclude efforts to tame inflation were failing.
Approximately two hours before the announcement, Bitcoin sunk 2% as market jitters took hold. Strangely, on the eve of the announcement, BTC rose rapidly, erasing those losses.
Despite that, once the CPI data was public, bears took control resulting in an immediate dip that bottomed at $18,200 during the 13:00 (UTC) hourly candle.
In a further unexpected twist, the 16:00 (UTC) hourly candle printed a 3.5% gain, triggering an uptrend that peaked at just short of $20,000 in the early hours of Friday.
The events could be described as a rollercoaster of emotions that somewhat negated fears of market weakness, at least in the near term.
Bitcoin closed Thursday up 1% to $19,380 and, at writing, has largely continued to hold onto those gains.
Volume
Each transaction requires a buyer and a seller. Once an agreement on the price is reached, the transaction is recorded as volume.
As such, volume refers to how many units of a particular cryptocurrency have been traded during a specific time period.
It is considered one of the fundamental influences on price action. Traders often use volume to gauge an understanding of the strength of a trend.
If volume is increasing, whether prices are going up or down, the general rule is that price will continue its current trend. However, if volume is decreasing, the current price trend will not likely stay its course.
Bitcoin Archive’s chart shows a decrease in price with increasing volume. As such, based on this single metric, the Bitcoin price will likely continue trending downwards.