Since the beginning of the year, the traditional financial market has been on a steady downward spiral. Russia’s invasion of Ukraine seems to have acted as a spark that ignited the problems that have been piling up since the beginning of the pandemic, devastating most assets in its way.
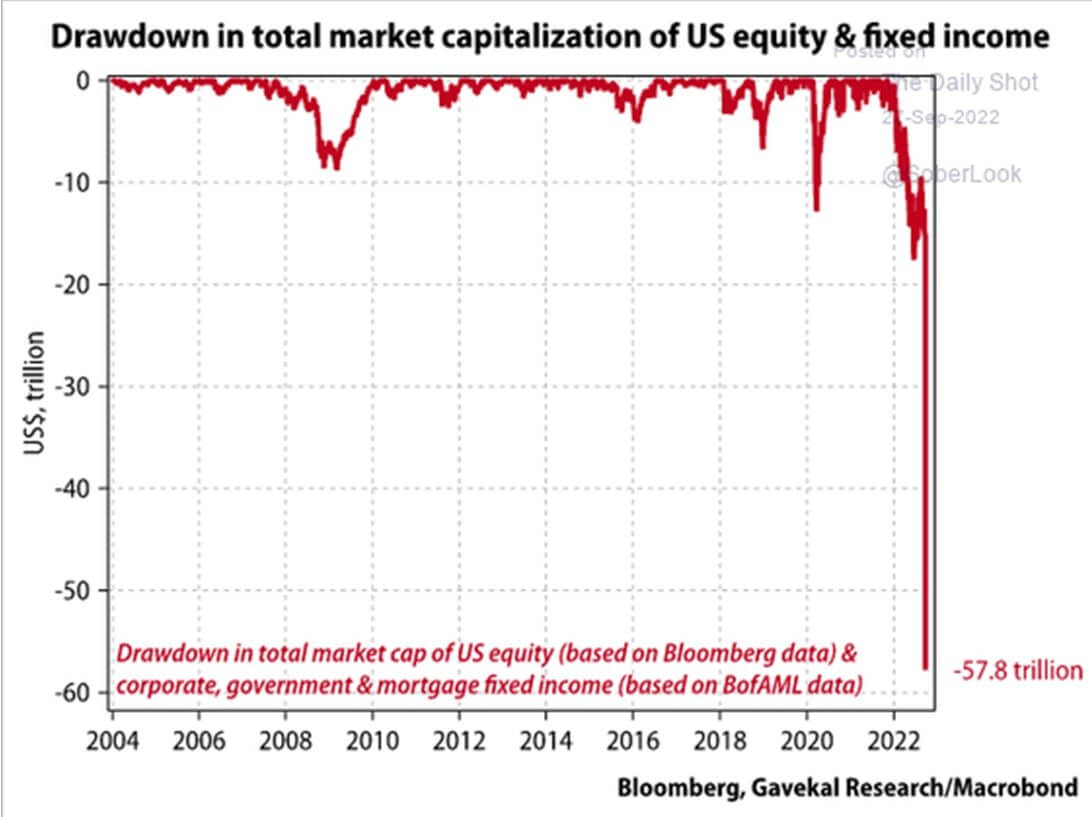
According to data from Bloomberg, almost $60 trillion has been wiped out from the total market cap of U.S. equity and fixed income since February. The current drawdown exceeds the market downturns seen at the beginning of the pandemic in 2020 and during the Great Financial Crisis in 2008.

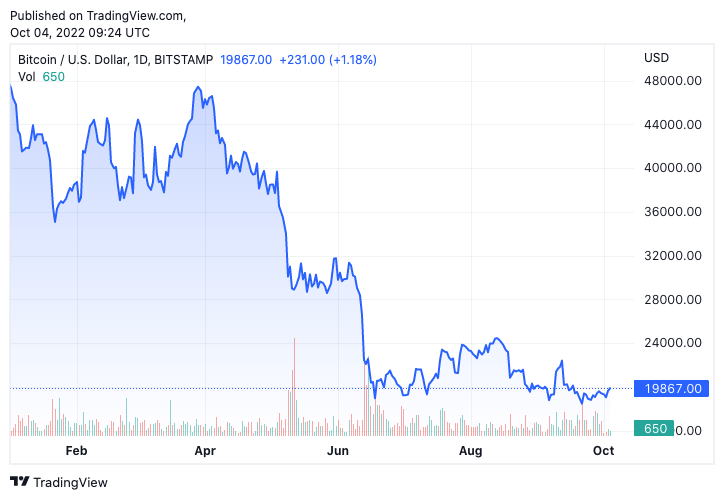
Bitcoin hasn’t been immune to the macro factors that have been devastating the tradfi markets. After the collapse of Terra (LUNA) in June, Bitcoin failed to recover and has been on a turbulent path of brief upswings and sharp corrections.

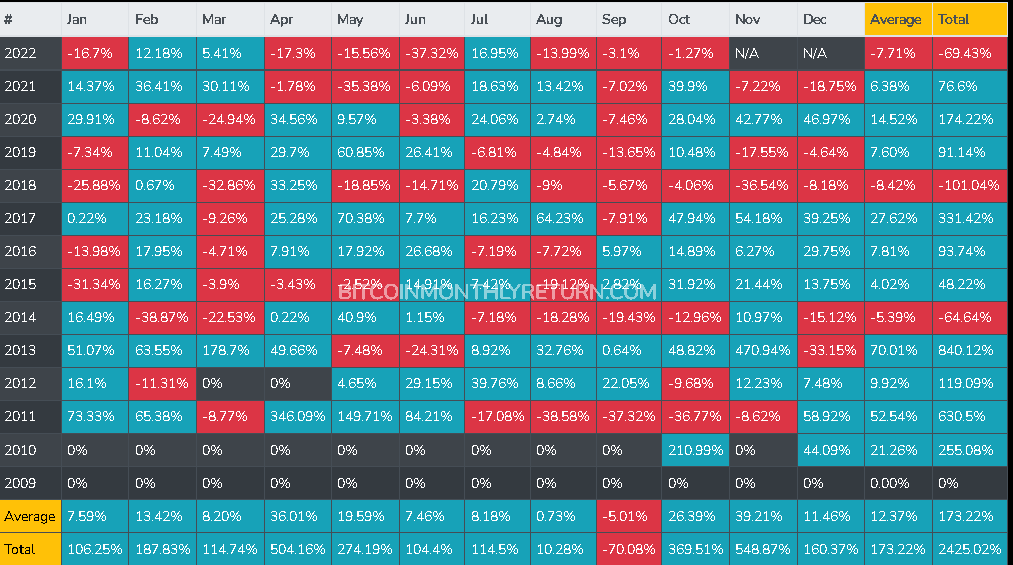
However, Bitcoin’s lack of upward momentum could be short-lived. September has historically been the worst month for Bitcoin — it failed to close the month in the green since 2016. Last month, Bitcoin closed the month at -3.1%, well below its monthly average of -5.01%.
October, on the other hand, has historically marked the beginning of a bullish quarter for the cryptocurrency, with Bitcoin’s monthly average close standing at 26.39%. It has also historically been the second-best month for Bitcoin, as it posted an accumulated total increase of 369.5% since 2009. The entire fourth quarter also saw historically positive closes.

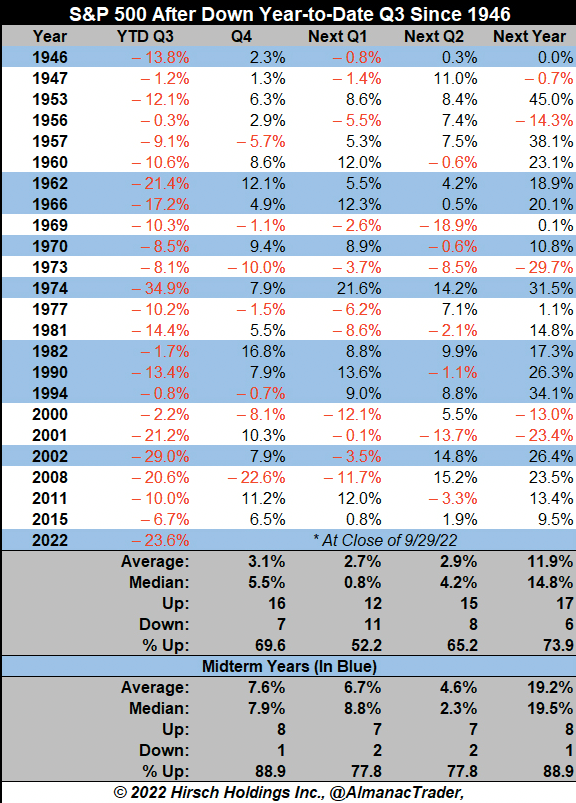
A September bloodbath is a recurring theme in the world of traditional finance as well. Since 1946, the S&P 500 posted negative year-to-date returns in the third quarter 23 times. Out of the 23 negative third quarters the S&P 500 saw, around 70% were followed by a fourth quarter with positive returns. During a year with midterm elections, this number rose to 89%.

If both markets continue their historical patterns, we could see the pressure decrease as October closes and a comeback of positive returns. However, with global macroeconomic factors continuing to worsen and putting more pressure on both markets, there’s an equally high probability that these patterns could break.


