

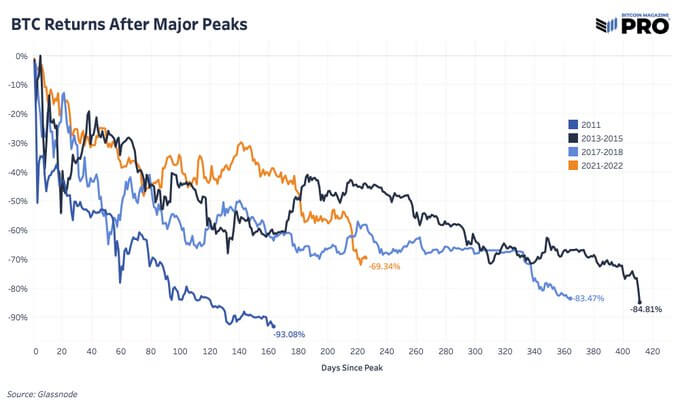
Market Analyst at Bitcoin Magazine, Sam Rule, tweeted a comparative chart of Bitcoin returns over the last four significant peaks. The most recent timeline, depicting our current situation, suggests more downside is to come.
The chart comprises the 2011 period, which ended after 160 days and a 93% drawdown; the 2013-2015 period, which ended after 410 days and an 85% drawdown; and the 2017-2018 period, which ended after 360 days, and an 83% drawdown.
The current 2021-2022 period is 220 days in, and so far, down 69% from the November 2021 peak.
Analysis of past Bitcoin drawdowns
The previous percentage drawdowns range between -93% and -83%, suggesting the current “live” drawdown of -69% has more to fall before reaching a bottom.
By examining the percentage drops sequentially, it’s noted that each period had progressively less severe declines. If the same pattern plays out this time, it may result in an approximate -80% drawdown. This would put Bitcoin at a bottoming price of around $13,800.
Moreover, the pattern above suggests BTC is becoming less volatile over time.
Regarding the length of each drawdown period, the most prolonged period was the 2013-2015 phase, at 410 days. But there is no discernable pattern to be extracted from the data.
Remember that past event should not be taken as an indicator of future performance. What’s more, this method of analysis does not take into account the macroeconomic landscape, which is a factor in the current 2021-2022 period.
The macro picture
Mainstream media reports a mixed bag as far as recessionary risk is concerned.
For example, CNBC recently featured commentary from Simon Baptist, the Global Chief Economist at the Economist Intelligence Unit. Baptist plays down the risk of an imminent recession. Instead, he said the likely outcome is stagflation, characterized by rising costs combined with slowed economic growth.
Also talking to CNBC recently, Larry Davies, the former Chief Economist at the Securities Exchange Commission, made a case for a likely coming recession, saying it’s hard to stop inflation [by raising interest rates] without going into recession.
“There will be a day of reckoning, the question is how soon.”
Meanwhile, Lenore Hawkins, Managing Partner at Calit Advisors, said, based on consumer spending, the recession may already be here.
“It’s worse than we saw in the 70s, in the real estate crisis in the 80s, and even the 9/11 terrorist attack and the financial crisis in 2008 – even those were not as tough on the consumer as what we’re seeing today.”
A squeeze on household incomes typically results in spending behavior prioritizing essentials. As such, demand for Bitcoin, and other non-essentials, will likely taper.