


After weeks of failing to break the tough resistance, Bitcoin surged above $21,000. The few short hours it spent above $21,000 before a slight correction brought some much-needed confidence back into the market.
While it’s hard to estimate how long the correction will last, exchange data suggests that BTC is currently up against a much healthier market that might lead to another surge soon.
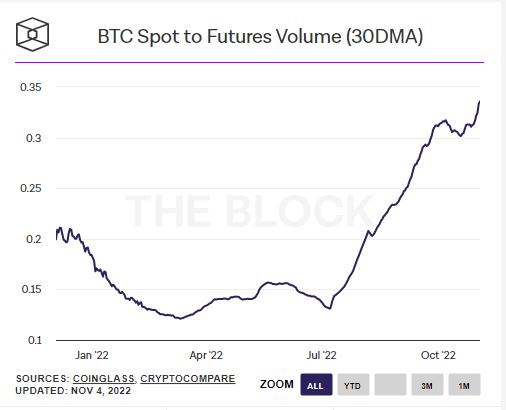
Data analyzed by CryptoSlate showed that there has been a significant decrease both in the number of futures contracts and their volume since the end of October. Spot volumes on exchanges have been on the rise, signaling a recovering retail buying pressure.
The ratio between Bitcoin’s spot and futures volume has reached its year-to-date high after a slight correction in mid-October, continuing the upward trend that began in July.
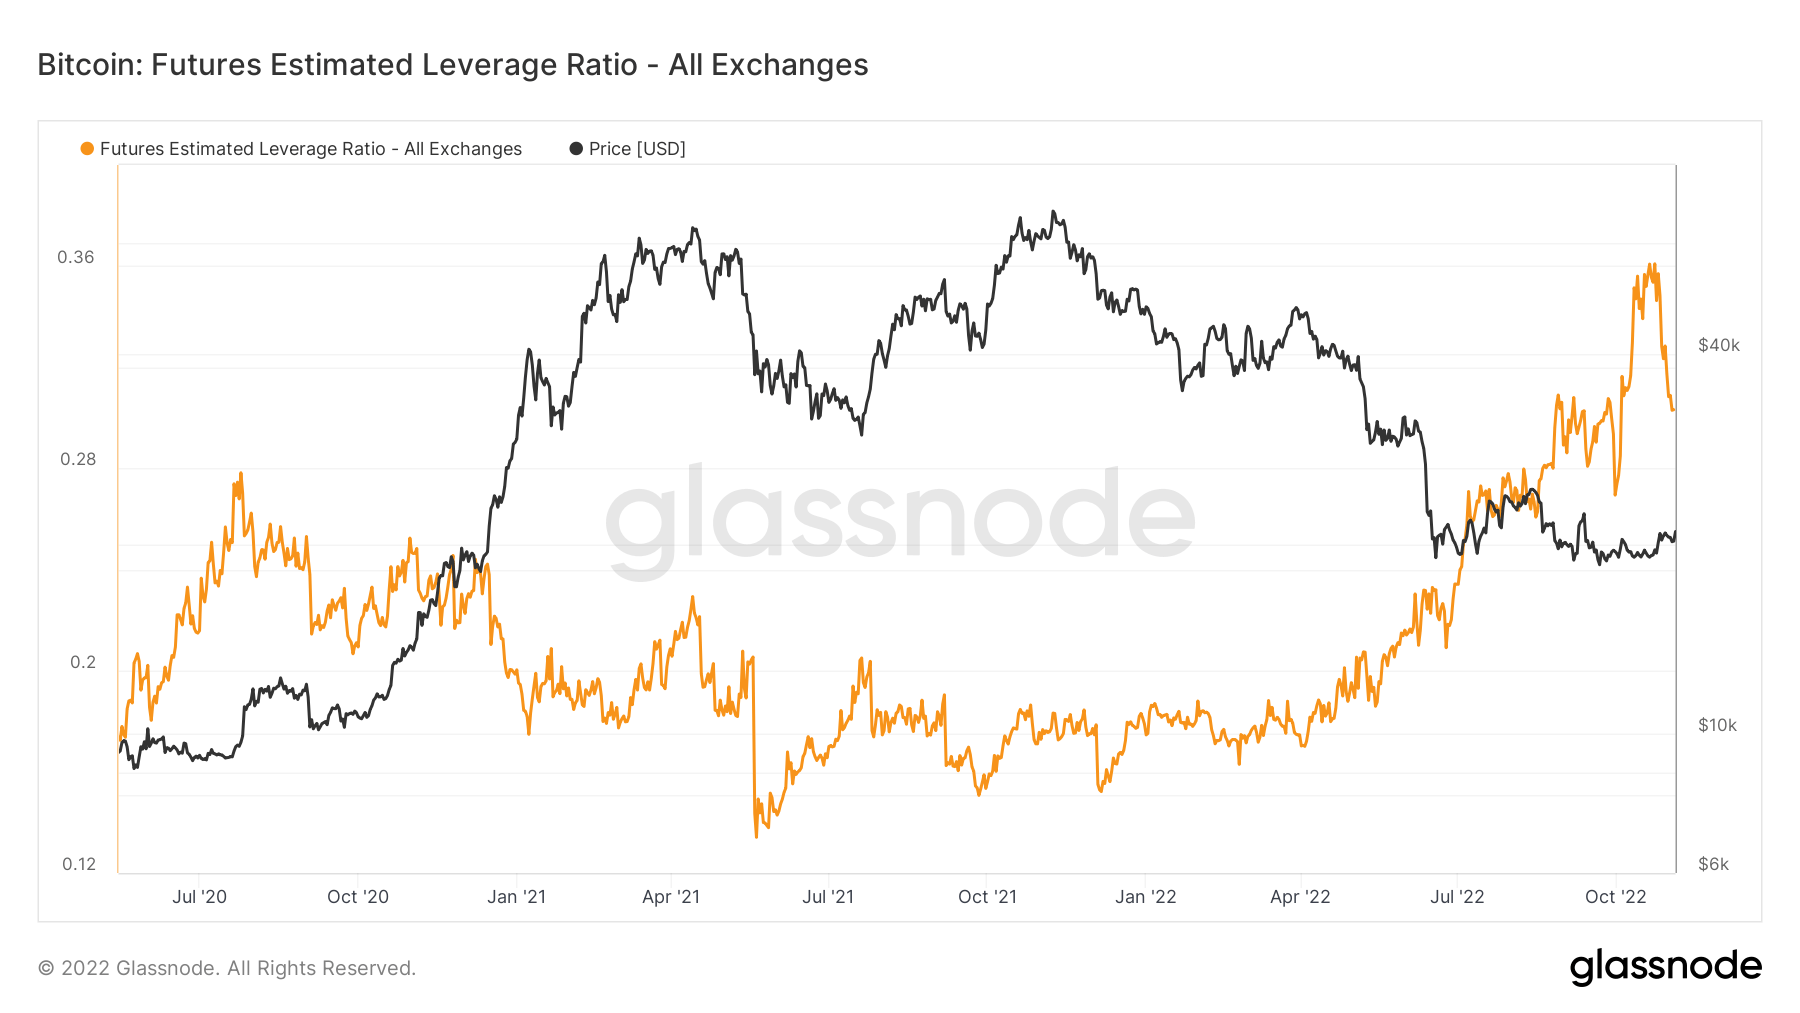
A deeper look at Bitcoin derivatives reveals a much less volatile market. The Bitcoin Futures Estimated Leverage Ratio (ELR) shows the proportion of open interest divided by the reserves of an exchange. Open interest is the total number of outstanding derivatives contracts. The Bitcoin ELR shows the average leverage used by derivative traders and has historically been a solid indicator of market volatility — the higher the ratio, the bigger the liquidation risk for derivative traders.
After reaching an all-time high of 0.34 in October, ESL has dropped sharply and currently stands at 0.30.
The stability caused by the derisking of the derivatives market has the potential to create a new resistance point for BTC at $21,000. Friday’s surge past $21,000 pushed Bitcoin above its realized price of $21,092 for the third time this year.
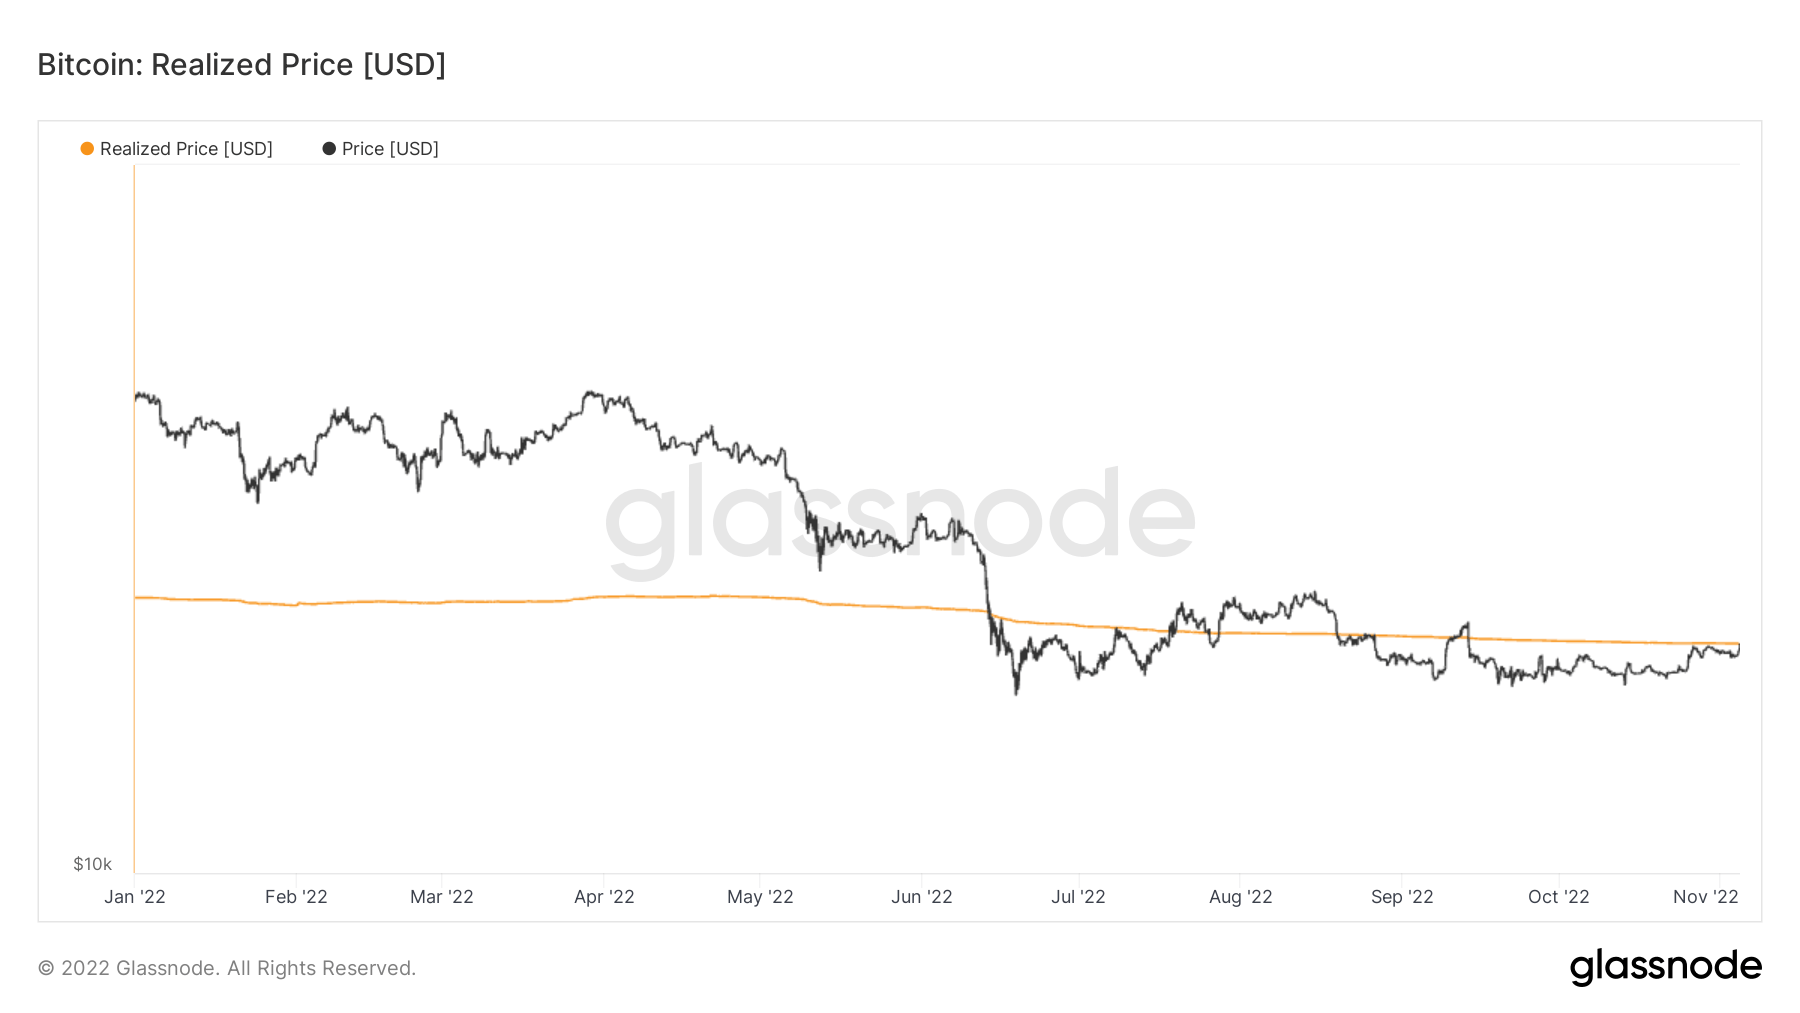
Bitcoin’s realized price is a useful metric as it shows the realized market capitalization divided by the current supply — i.e. the average price at which all bitcoins in circulation were purchased. When BTC’s spot price rises above the realized price there’s a high likelihood that solid support will be formed.