


Analysis of Bitcoin and Ethereum exchange flows revealed opposing activity for the top two tokens, with the market leader establishing clear dominance in terms of holding long-term.
Exchange flows are the number of tokens deposited or withdrawn into or out of an exchange wallet. A popular on-chain metric to assess this is Exchange Net Position Change.
Exchange inflows are generally considered bearish, as the primary reason to move tokens to an exchange is to sell the token. In contrast, exchange outflows are generally considered bullish, as withdrawing tokens is usually for the purpose of holding for the long term.
Examining the flow of tokens into and out of exchanges makes it possible to determine bearish or bullish investor sentiment.
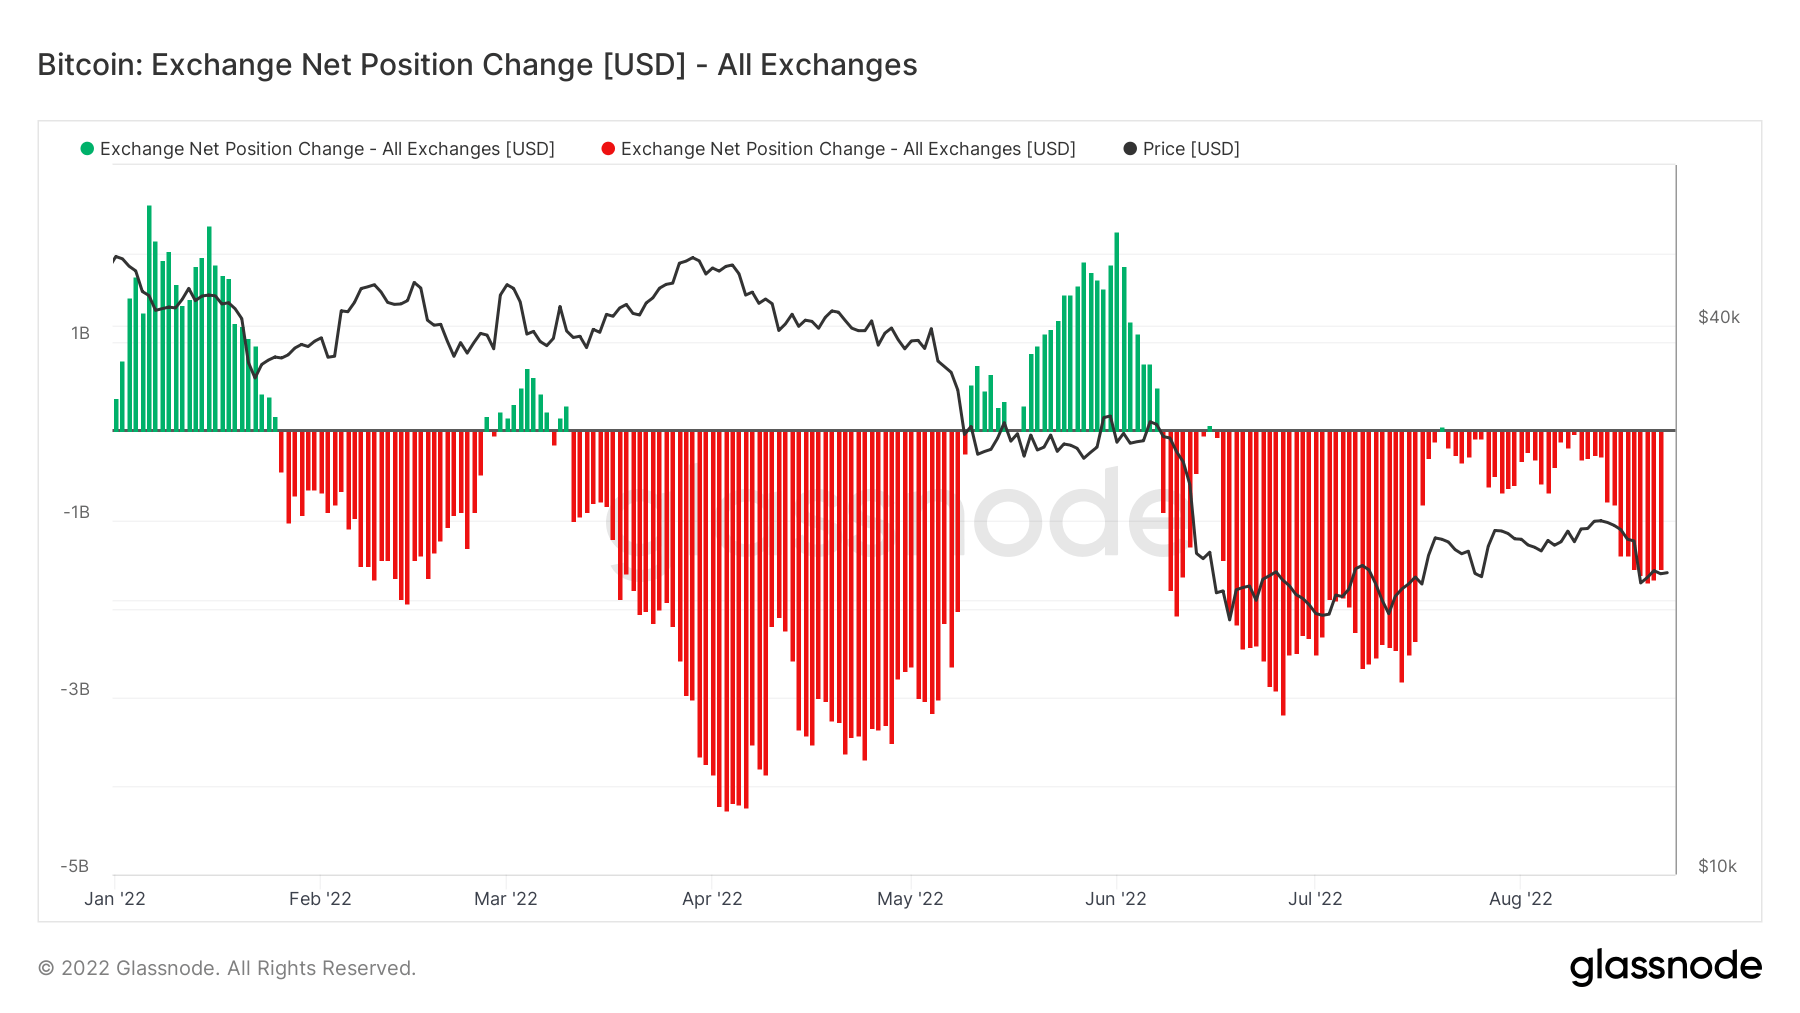
Bitcoin Exchange Net Position Change
Following sharp price declines due to the Terra scandal and subsequent industry-wide de-leveraging, Bitcoin bottomed on June 18 at $17,600. The chart below shows consistent exchange BTC outflows since bottoming, with daily outflows topping over $1 billion daily on average.
Over the last week, the exchange outflow rate has increased significantly, despite Bitcoin dropping to as low as $20,800 on August 19. This suggests that investors see value in the current price range.
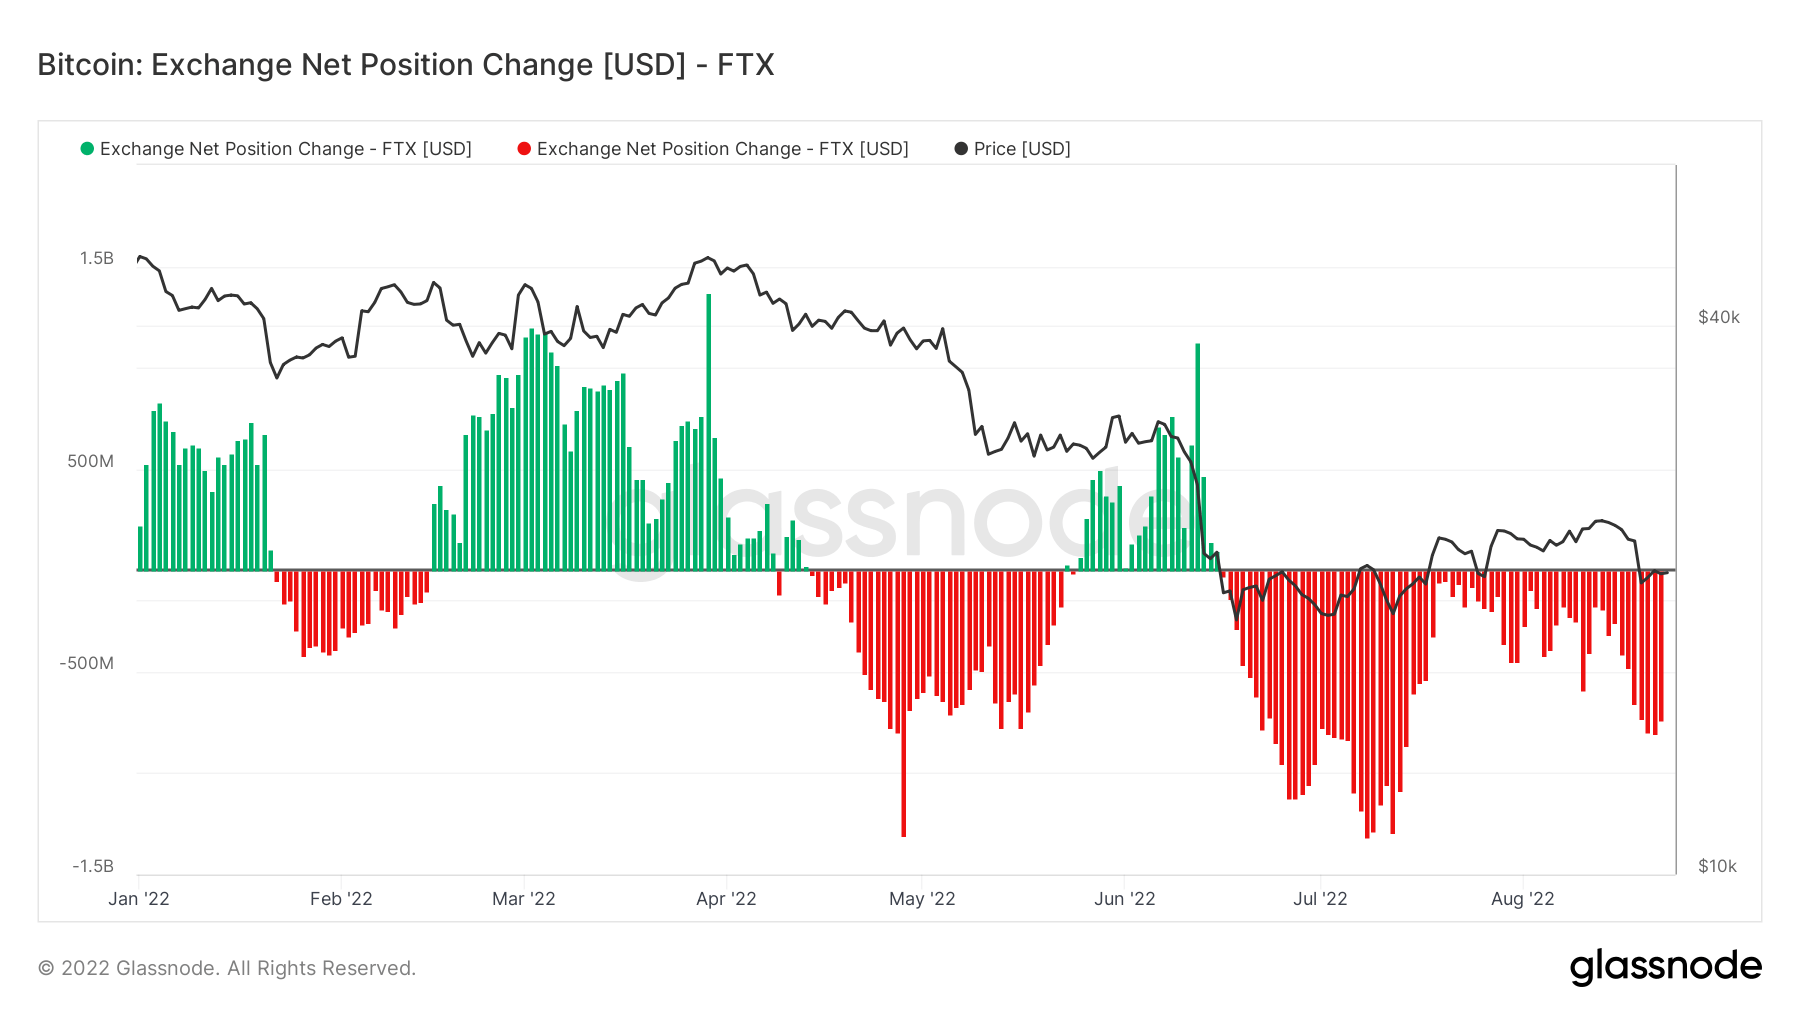
The FTX exchange made up over half of the total outflows in the last week. There are no obvious fundamental reasons for this occurrence. However, on August 20, “leaked documents” revealed that FTX grew its revenue by over 1,000%, from $90 million in 2020 to $1 billion in 2021.
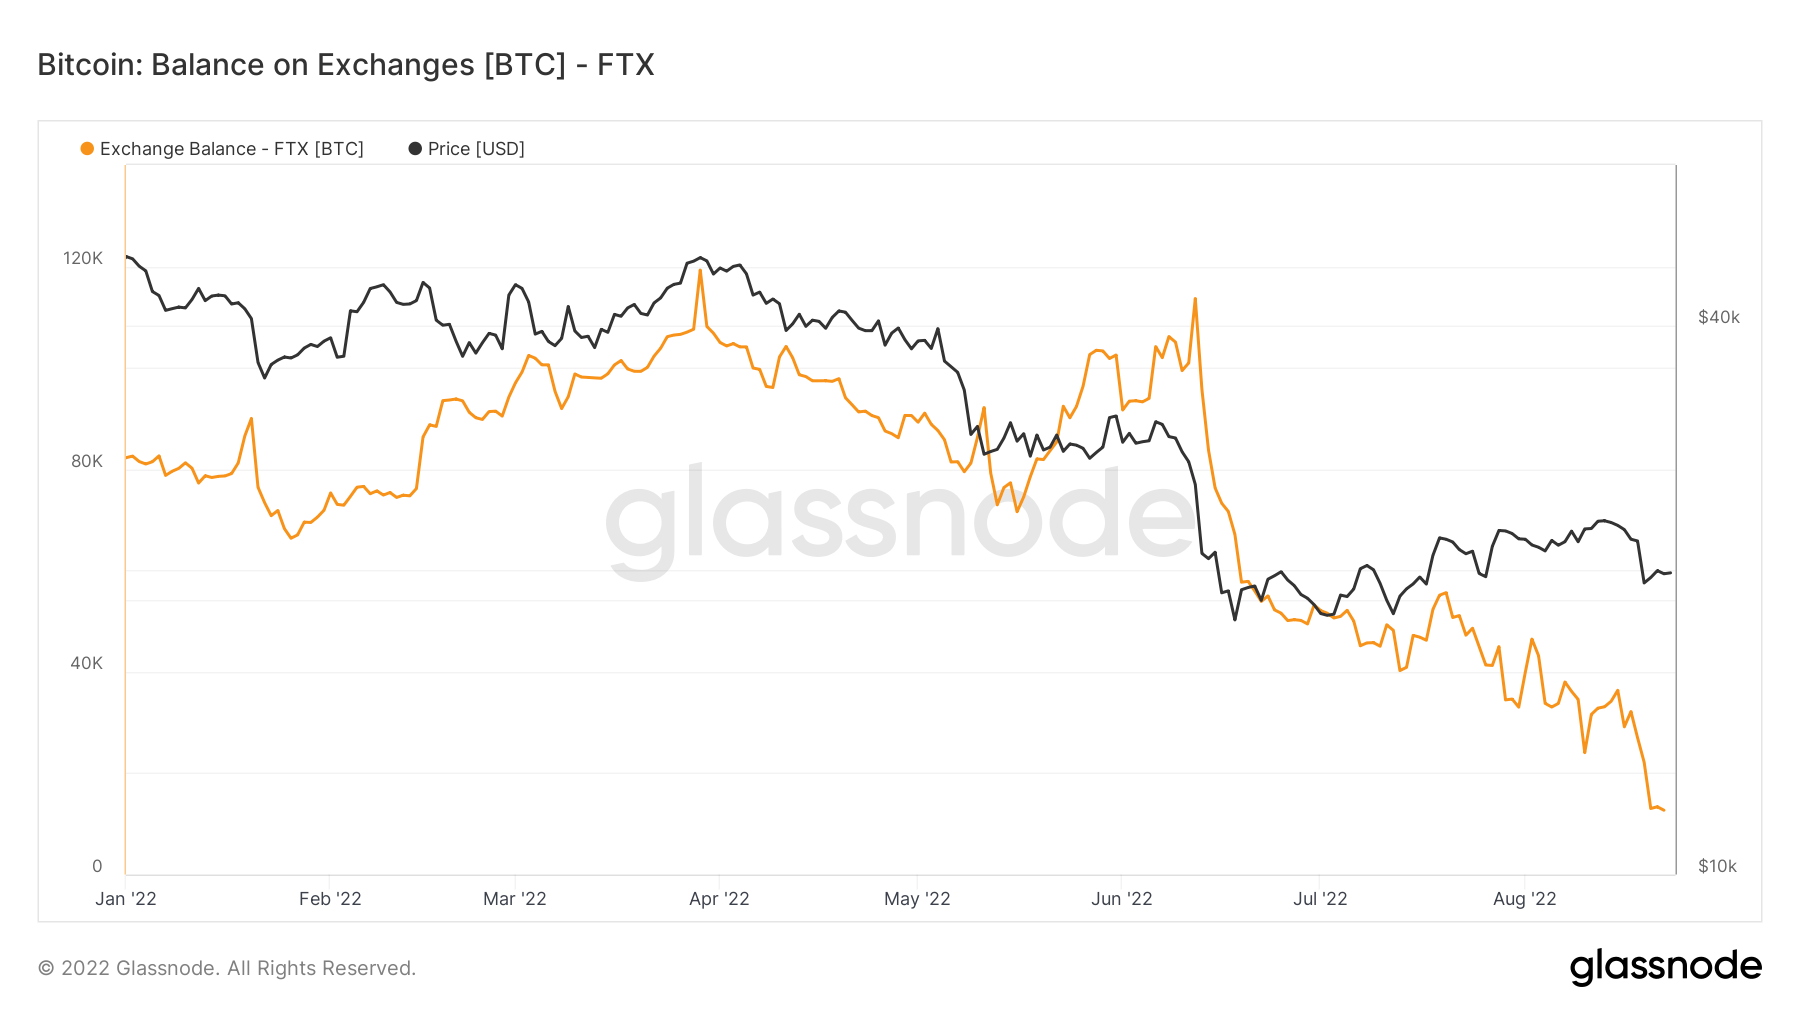
Further analysis of FTX’s BTC reserves shows a significant decline in holdings. In March, the company held over 120,000 BTC. But now, part way through Q3, this has dropped to just 13,000 tokens, with the period from June showing the sharpest drop, leading into a progressive fall off in BTC held.
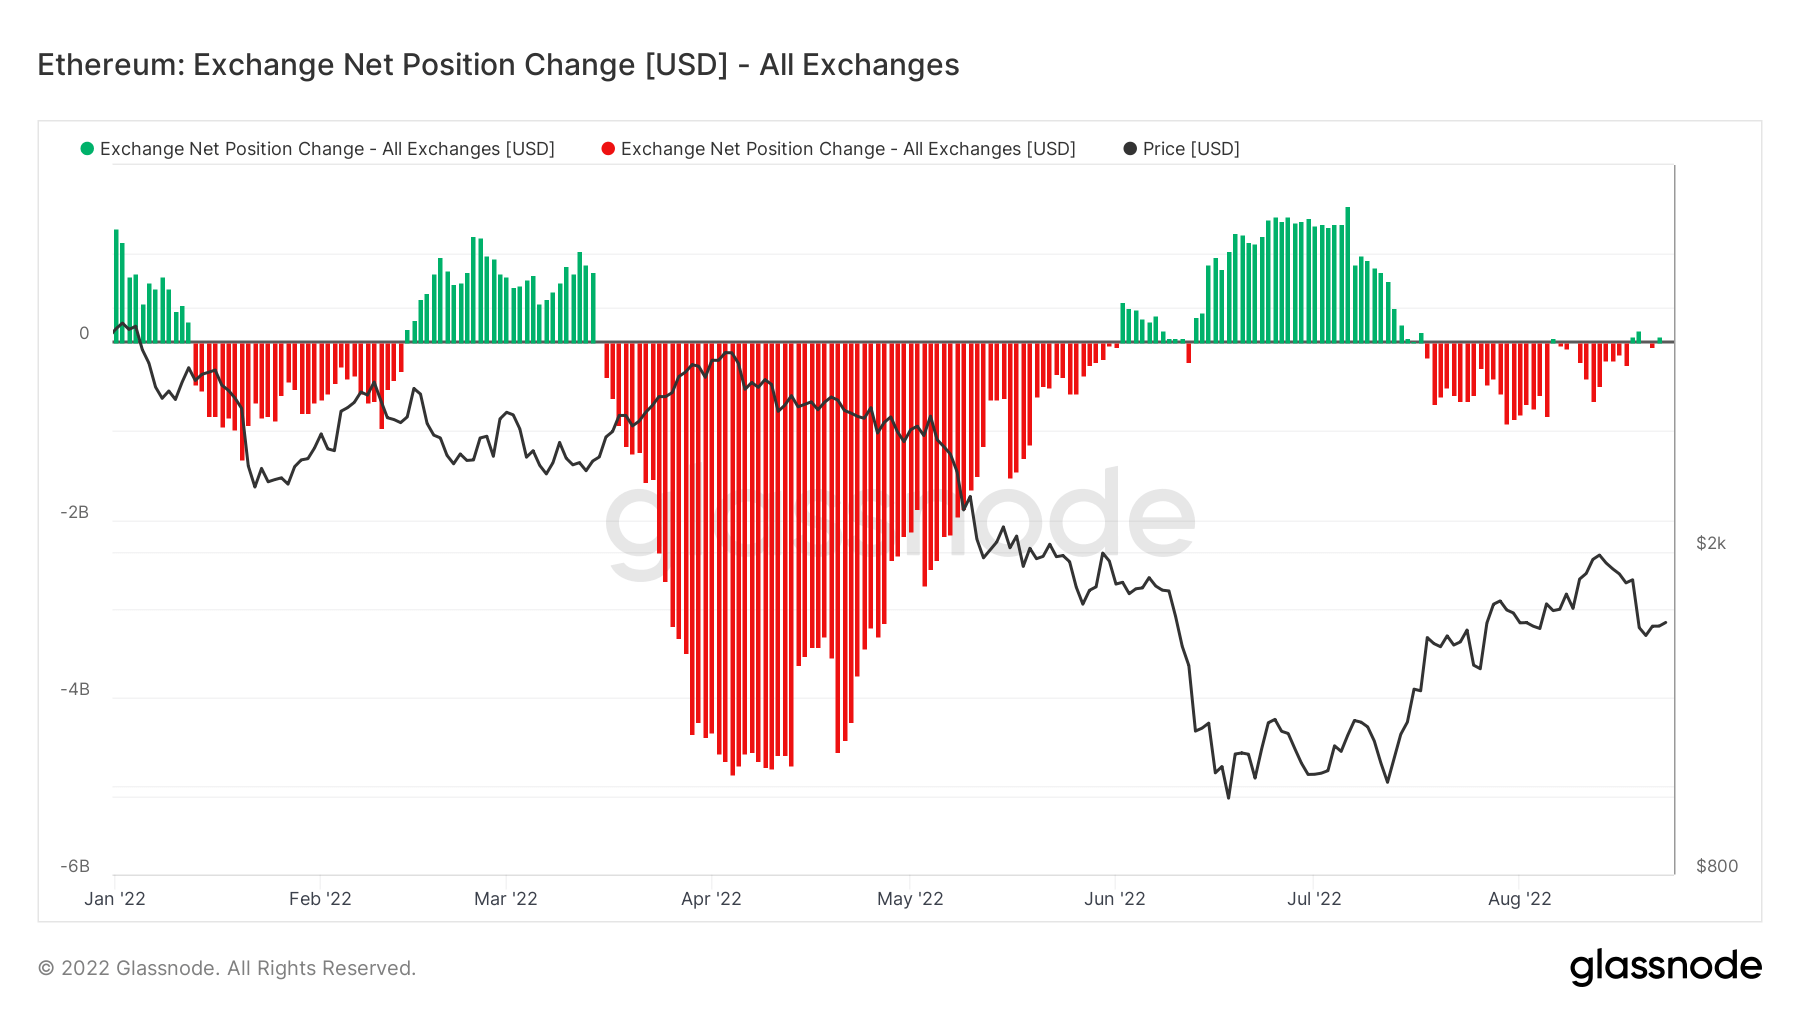
Ethereum Exchange Net Position Change
By contrast, Ethereum’s Net Position Change shows that despite massive outflows from mid-March onwards, the amount of tokens leaving exchanges has reverted close to net zero.
This development is a negative sign, especially as the Merge approaches. It suggests investors think the switch to Proof-of-Stake (PoS) is a “buy the rumor, sell the news” event.
The contrasting activity between Bitcoin and Ethereum may indicate that investors view BTC, and not ETH, as the long-term play against macro developments, such as inflation or escalation of geopolitical tensions.