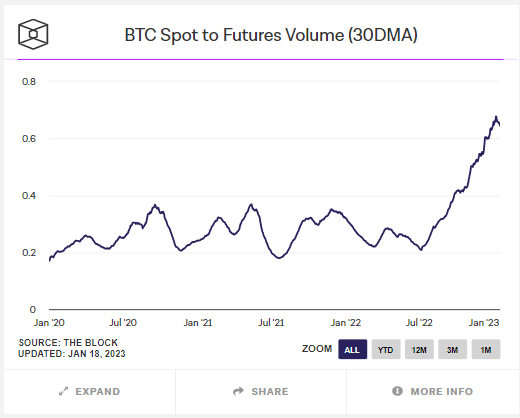
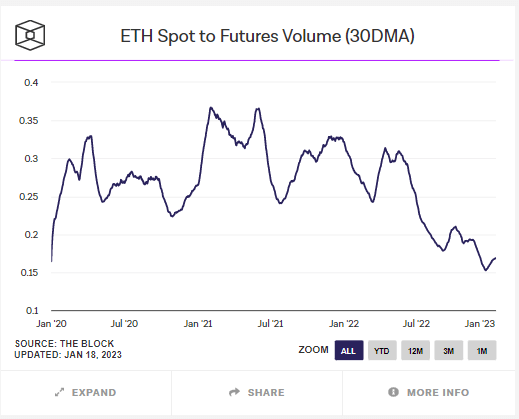
Data analyzed by CryptoSlate showed a strong contrast between Bitcoin and Ethereum Spot to Futures Volume (SFV) trends, with the former’s SFV continuing to rise.
The Spot to Futures Volume metric looks at the ratio of spot volume against futures volume for a particular cryptocurrency.
Spot price refers to the current quote for the immediate purchase of the cryptocurrency and forms the basis for all derivatives markets. Strong spot volume equates to healthy accumulation, leading to sustainable price growth.
Retail buyers typically use spot markets, whereas institutions and experienced, well-financed traders tend to trade derivatives.
Bitcoin vs. Ethereum Spot to Futures Volume
Per the chart below, the Bitcoin SFV has oscillated relatively uniformly between 0.2 and 0.4 since January 2020. However, the SFV broke out of this range last summer, climbing higher to peak at just under 0.7 this week.
In other words, Bitcoin spot volume is rising in proportion to futures volume, suggesting retail traders are piling in at a rate greater than derivatives traders.

In contrast, the Ethereum SFV print shows a more haphazard pattern. Unlike the previous example, the ratio of the spot to futures volume has been recording lower lows since May 2022, with the latest low coming in at 0.15.
This would imply institutions and professional traders continue to dominate ETH markets.

The derivatives market
The crypto derivatives market (along with covid stimulus) was a factor in buoyant spot prices during 2021.
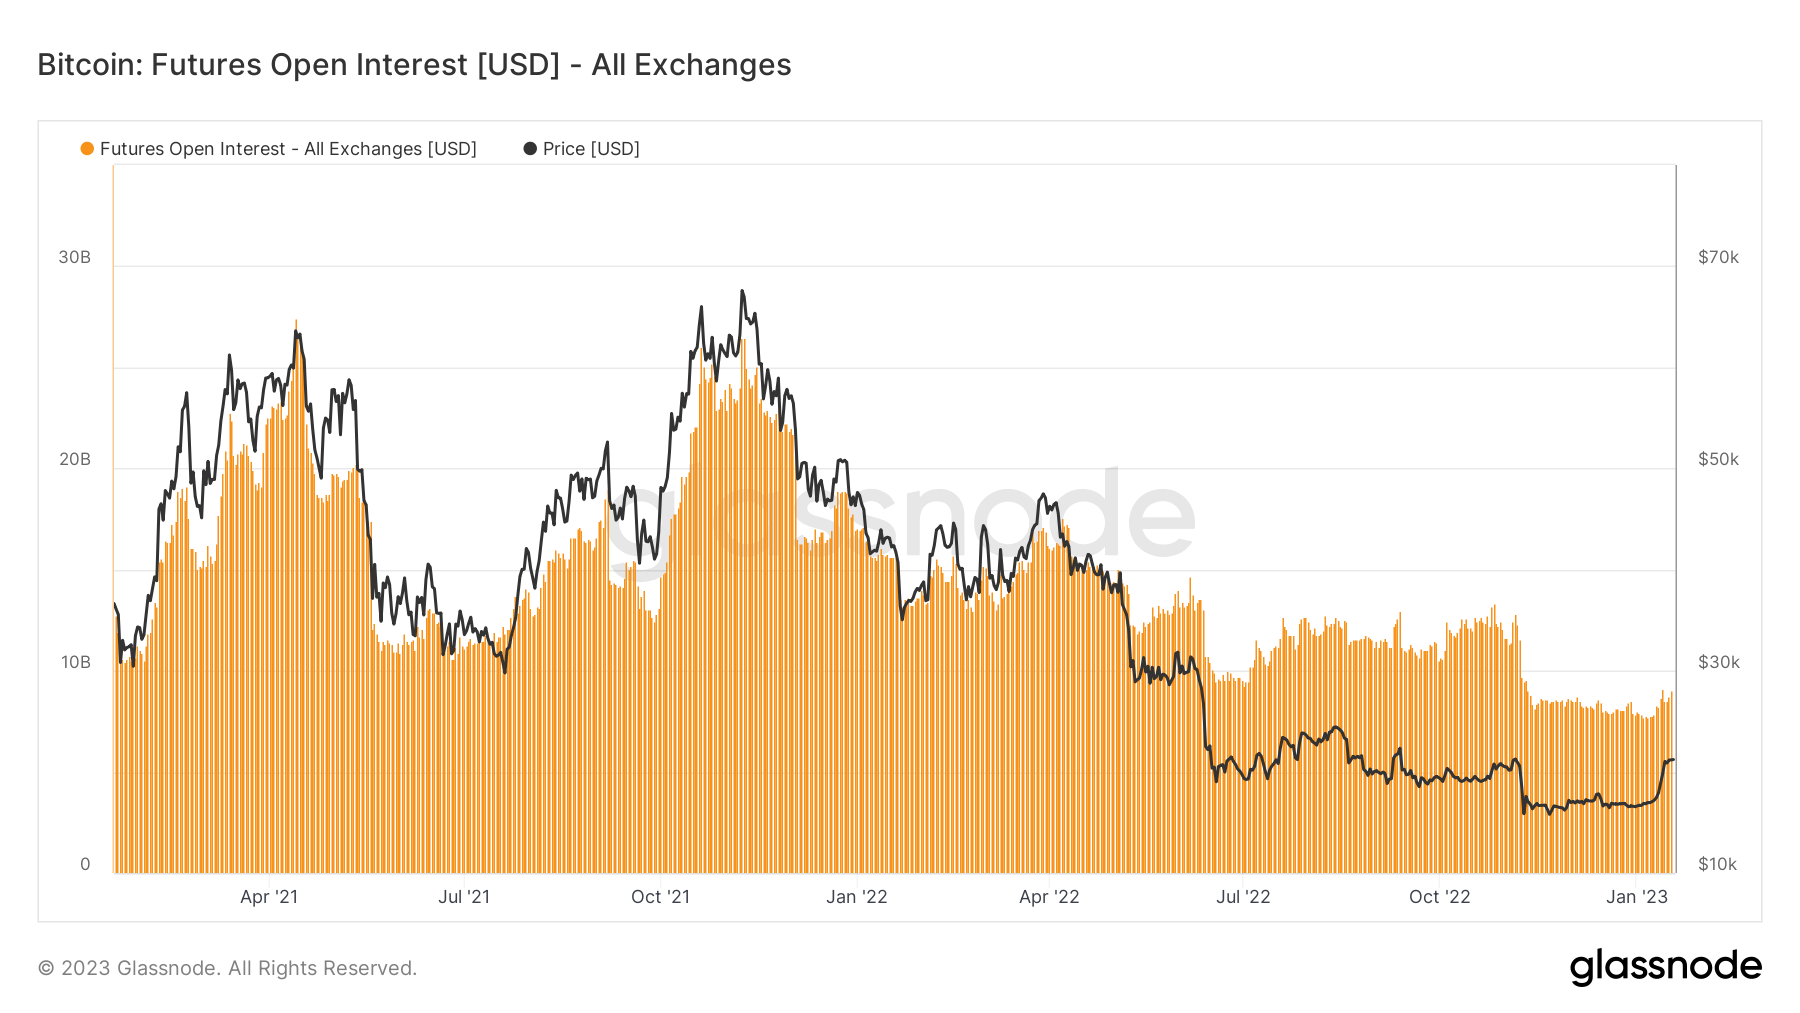
For example, the chart below shows Futures Open Interest hitting over $25 billion on three occasions in 2021, coinciding with spikes in the spot price to $64,670, $67,100, and $69,200. It was likely that the leverage used in derivatives trading influenced spot exuberance at the time.
However, Futures Open Interest has dropped significantly since November 2021. Further, for unknown reasons, the relationship between Open Interest and spot price came undone around May 2022.

Based on this, retail buyers had a significant hand in Bitcoin’s recent resurgence back above the psychological $20,000 level.


