There’s no denying that the last seven odd months have been extremely bearish for the crypto market, with Bitcoin, the world’s largest cryptocurrency by total market capitalization, only witnessing year-to-date (YTD) monetary inflows worth just $14 million.
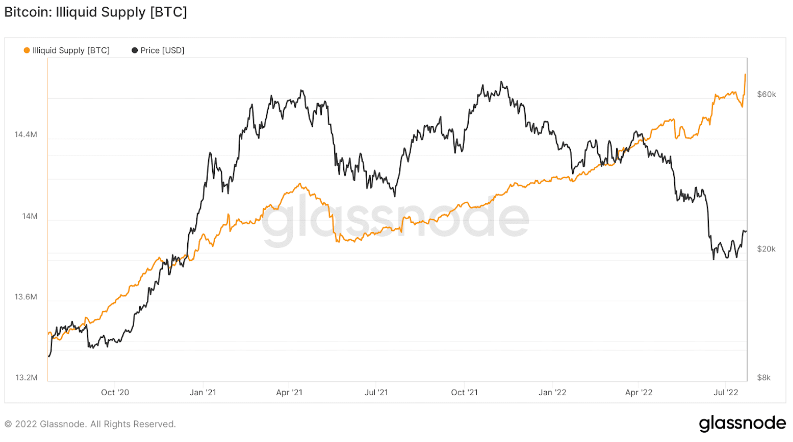
Furthermore, the flagship crypto’s illiquid supply ratio — i.e., the number of Bitcoin being moved out of exchanges and into hardware “cold storage” wallets or app-based “hot” wallets — has been on the rise since the start of 2022.
To elaborate, over 14.8 million illiquid BTC tokens currently exist, with this number having risen quite sharply (by approximately 500k) during the first half of the year alone. This is largely due to a host of macroeconomic factors surrounding the global economy (such as the recent Russian invasion of Ukraine, rising crypto liquidations, surging inflation and interest levels, etc.).
It is also pertinent to note that the total number of BTC in circulation currently stands at around 19 million, with around 900 coins being mined and added to the currency’s total supply pool per day.
In all, it is estimated that 76% of the cryptocurrency’s total supply is currently classifiable as illiquid, which is quite staggering considering that more than 90% of all Bitcoin that can ever exist has already been mined.

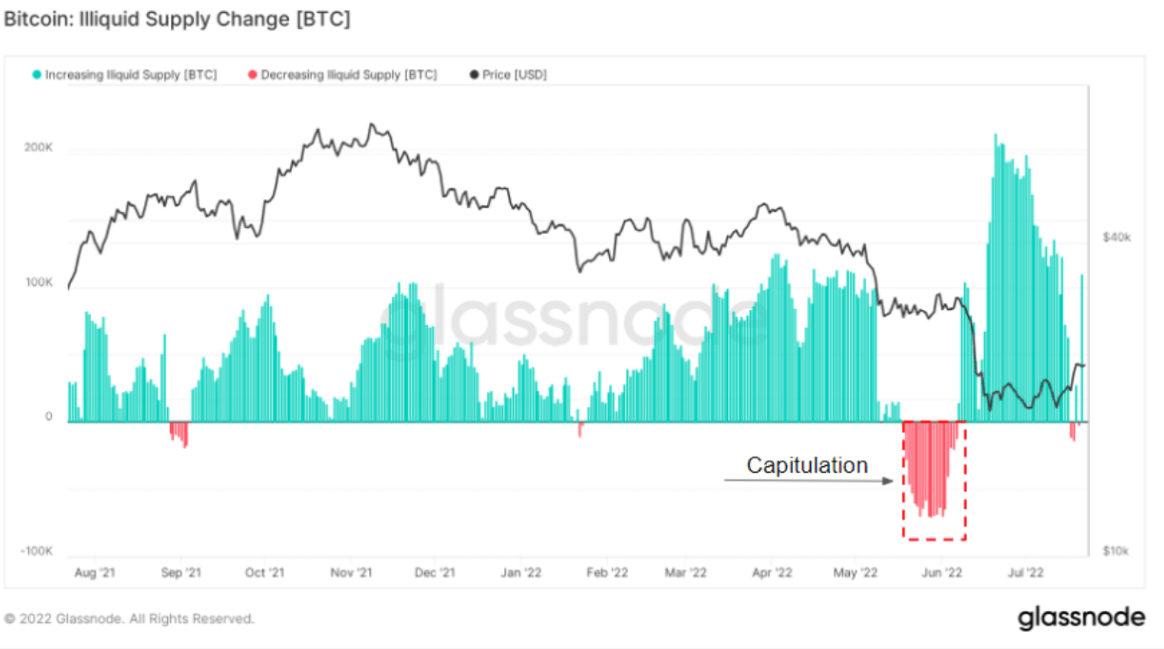
This rise in illiquid supply is also supported by associated metrics such as Bitcoin’s ‘illiquid supply change,’ which is the monthly (30-day) net change in the supply of the digital currency held by illiquid entities. This is important because the recent macro-level events surrounding the market — such as the insolvencies of key market players like Three Arrows Capital, Celsius, Vauld, and Zipmex — have resulted in consumers learning the importance of self-custody (ala ‘not your keys, not your coins’).
To this point, the graph below clearly shows that the general trend surrounding investors moving their Bitcoin into external wallets has been on the rise, especially after the above-stated capitulations in June.

Bitcoin’s illiquid supply has been in a phase of continued accumulation for over six months, only to be interrupted last month. However, as visible above, the trend is again on the upturn, with more gusto than ever before. These sudden surges can have an adverse effect on the supply dynamics of Bitcoin, potentially resulting in the asset’s price being faced with a lot of volatility in the near-to-mid term. Therefore, it remains to be seen what the future has in store for Bitcoin.


