In light of DeFi’s recent lending market economic attacks, risk monitoring and management has become a key factor for success within the ecosystem. Appropriate procedures need to be taken into account in order to ensure the future growth of the space. This article aims to explore the recent Mango Markets economic attack, how it was orchestrated, and possible mitigation strategies.
In order to understand how susceptible DeFi protocols are to each specific type of risk, we delve into the 62 largest incidents that have taken place to date. This includes hacks in the hundreds of millions for bridges, economic collapses of algorithmic stablecoins, and outright robbery of user funds.
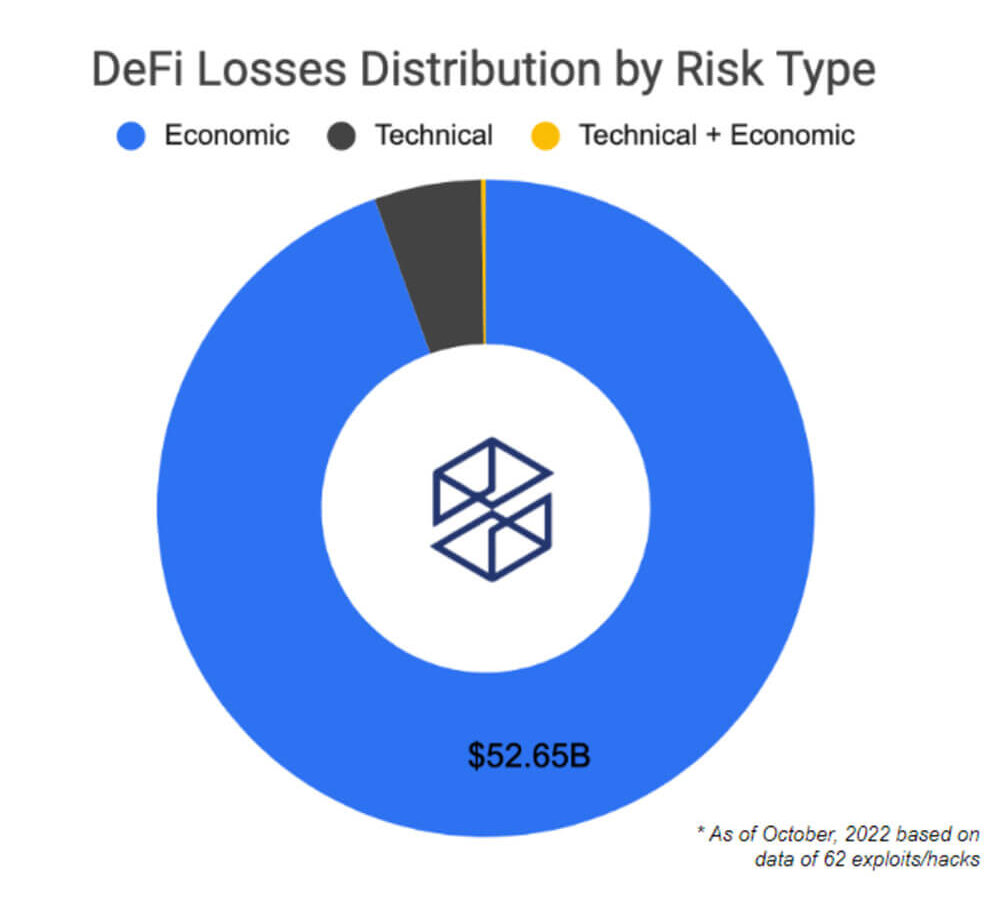
Here is the distribution of the main risk factors behind the 62 largest DeFi attacks. Over $50B in losses are accounted for economic risks. This estimate includes the collapse of the infamous Terra ecosystem. Despite technical factors being behind the most number of attacks in DeFi, a greater dollar value has actually been lost due to economic risks.
Moreover, the recent series of economic attacks on several lending protocols like Mango and Moola has brought light to the danger that this poses over the ecosystem. In addition, many of these lending protocols were attacked using the same vector. The attack consisted of a highly complex strategy in which the attacker identified the supported collateral asset with the lowest liquidity and market cap. Low liquidity assets are the most vulnerable to flash loans or price oracle manipulation attacks.
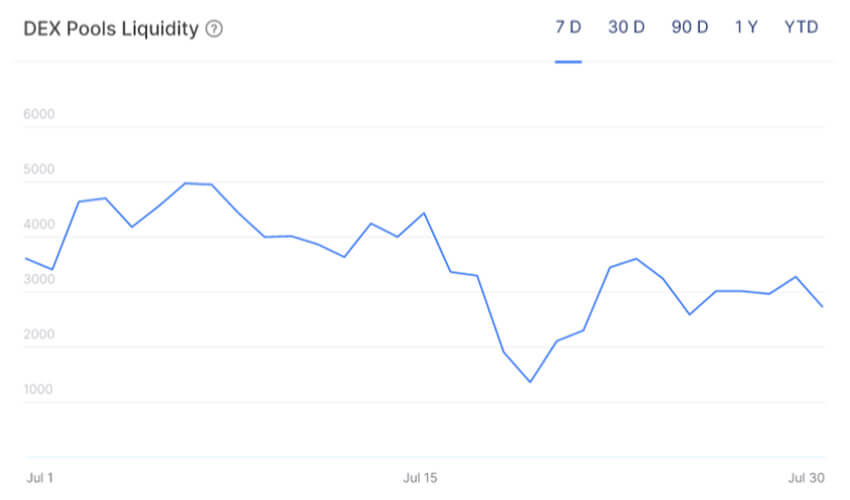
The indicator shown above is just for educational purposes; no live data is shown since it’s just for reference. DEX Pools Liquidity indicator is part of a set of mock-ups built for a proposal on the Euler forum.
By tracking liquidity available for an asset in decentralized exchanges, we can gauge how prone it can be to being manipulated. A healthy level of available liquidity for supported collateral assets is an important safety factor. In the case of low liquidity tokens listed as collateral, problems of stability in the protocol could arise. Moreover, this could facilitate an easier path for price manipulation, in which attackers take advantage of the protocol.
The main goal of an attacker orchestrating this type of attack will be to increase the amount of money he can borrow. This could be done by pumping the spotted low liquidity asset in order to be able to borrow large quantities of other supported, more stable assets.
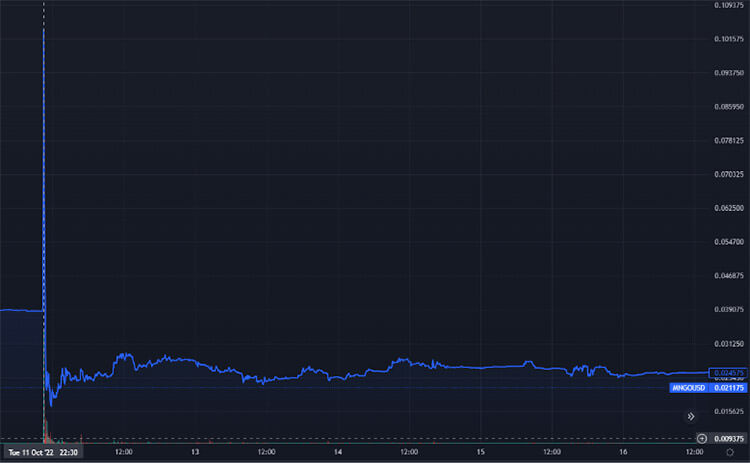
The graph above portrays the MNG token price on the FTX exchange. In this case, the attacker combined the lending functionalities of the protocol with its perpetual contracts. The attacker manipulated the spot price on Raydium, which triggered an oracle update. This enabled him to borrow against another open position that he had previously placed on the Mango Markets protocols. Eventually, when the MNGO price recovered, the protocol was left with a debt default.
In relation to the indicators shown above, in which they try to figure out weak links in the protocol, there are also ways to try and figure out possible threats from the attacker side. Usually, economic exploits are fastly executed; hence indicators shown below serve educational purposes in trying to assess potential threats from the supply concentration of whales.
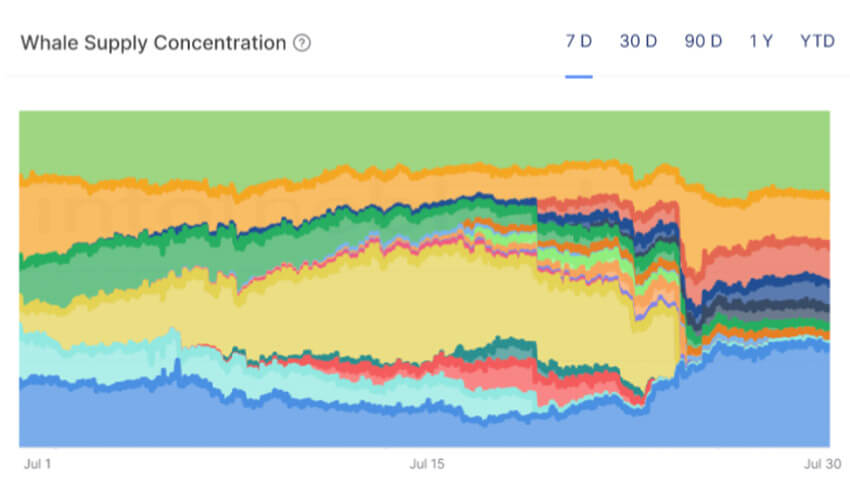
The Whale Supply Concentration indicator is also part of the proposal on the Euler forum. This indicator is useful to spot potential threats to the protocol depositors. For example, if one of the largest protocol depositors is in the least liquid asset that the protocol supports as a collateral asset, it could be worth to further looking into the specific address.
This indicator could be valuable to use together with the DEX Pools Liquidity indicator shown above and is particularly worth monitoring if the concentration whale tokens is one of the weakest tokens supported by the protocol. This could help bring light to possible damaging events.
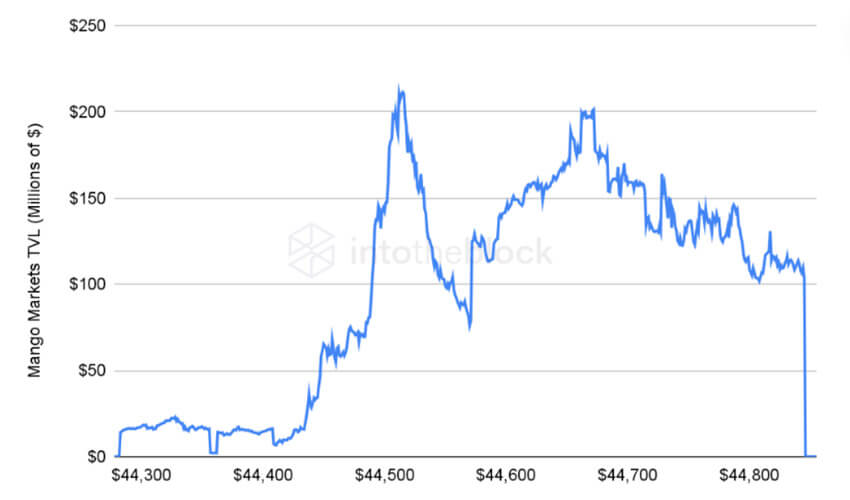
Mango Markets protocol TVL can be seen on the indicator above. A clear drop can be seen after the attacker borrowed money with his position on the MNGO token as collateral. Ultimately the protocol was left with bad debt due to the price manipulation events.
Appropriate tools like the above-shown aim to move the DeFi ecosystem one step closer in the right direction. These are just some of the initial indicators that first describe the recent events and second try to protect users from incidents like this in the future. The object is that users and protocols gain an advantage from available on-chain information.