Ethereum has seen its price rise by 40% in the past month while the rest of the market has been licking its wounds from the June price crash. Despite its sheer size and network effect, Ethereum’s price has historically had a tough time decoupling from Bitcoin and has always followed Bitcoin’s rallies and drops.
However, this rally has little to do with Bitcoin, which has posted only a 20% recovery from the lows it reached in mid-June.
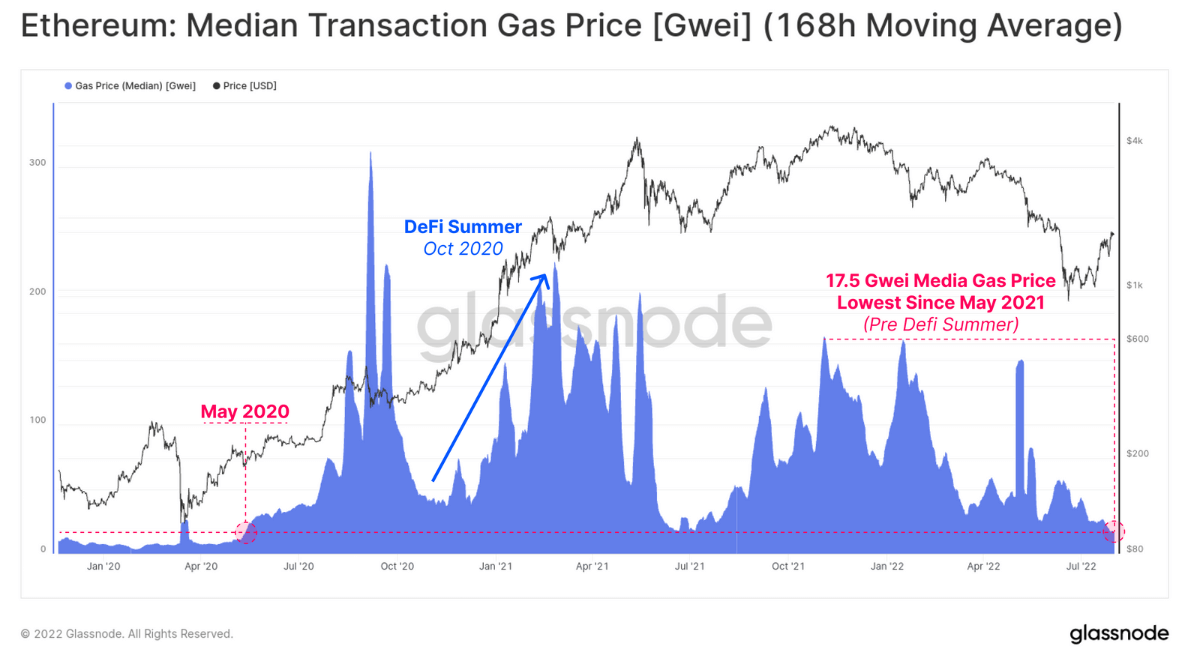
It also has little do with an increase in network usage. Ethereum gas fees have declined significantly this year and currently stand at 17.5 GWEI, the lowest they’ve been since May 2021. The low network congestion shows that user activity on Ethereum has been decreasing, with the overall number of users estimated to reach levels seen in May 2020 — before we’ve seen the network boom in the DeFi Summer of 2020.

Declining user activity stands in contrast to the rapidly rising price of ETH. This indicates that a large chunk of Ethereum’s current rally could be attributed to speculation as traders race to post profits ahead of the upcoming Merge.
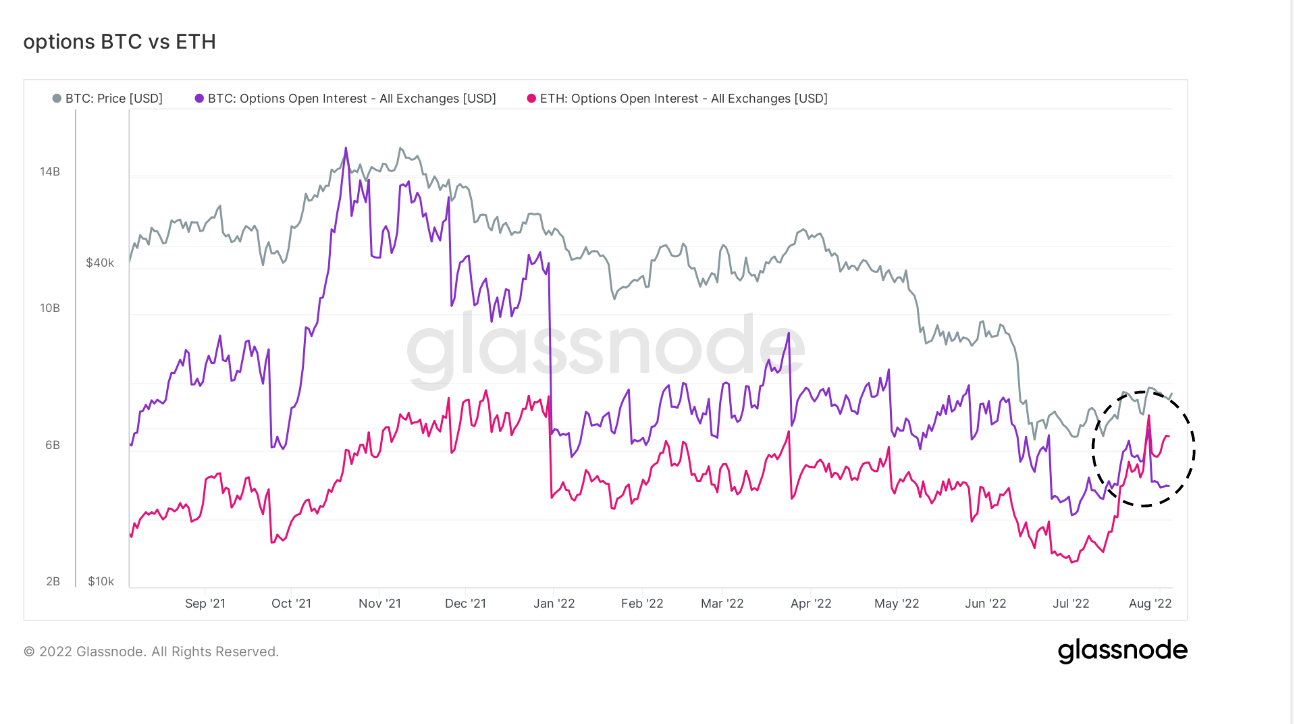
Derivatives also reveal an increasing number of traders are speculating on Ethereum’s further rise. This is the first time that open interest on Ethereum is greater than on Bitcoin — there’s currently $6.4 billion in Ethereum open interest for the Merge scheduled for September 19th, compared to $5 billion in Bitcoin open interest.

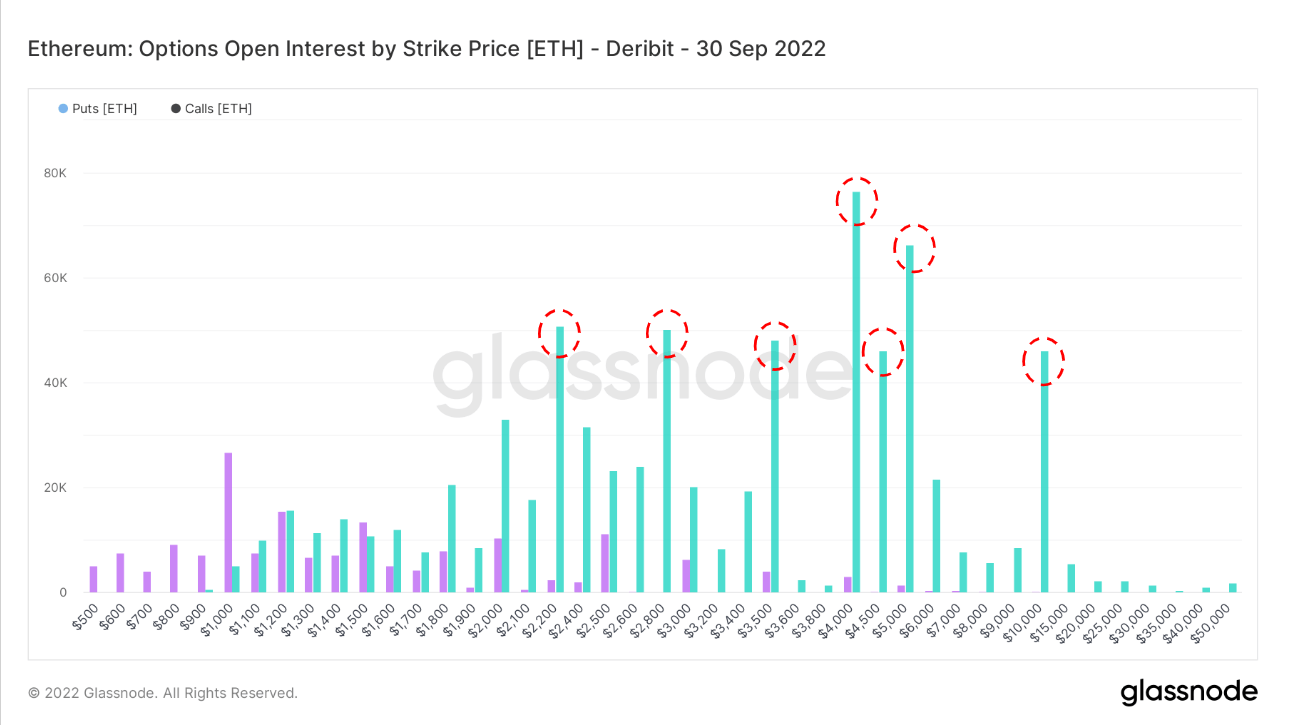
The total open interest of call and put options by strike price favor call options contracts. The majority of Ethereum’s options are call options concentrated on September 30th, with the most calling for $4,000.

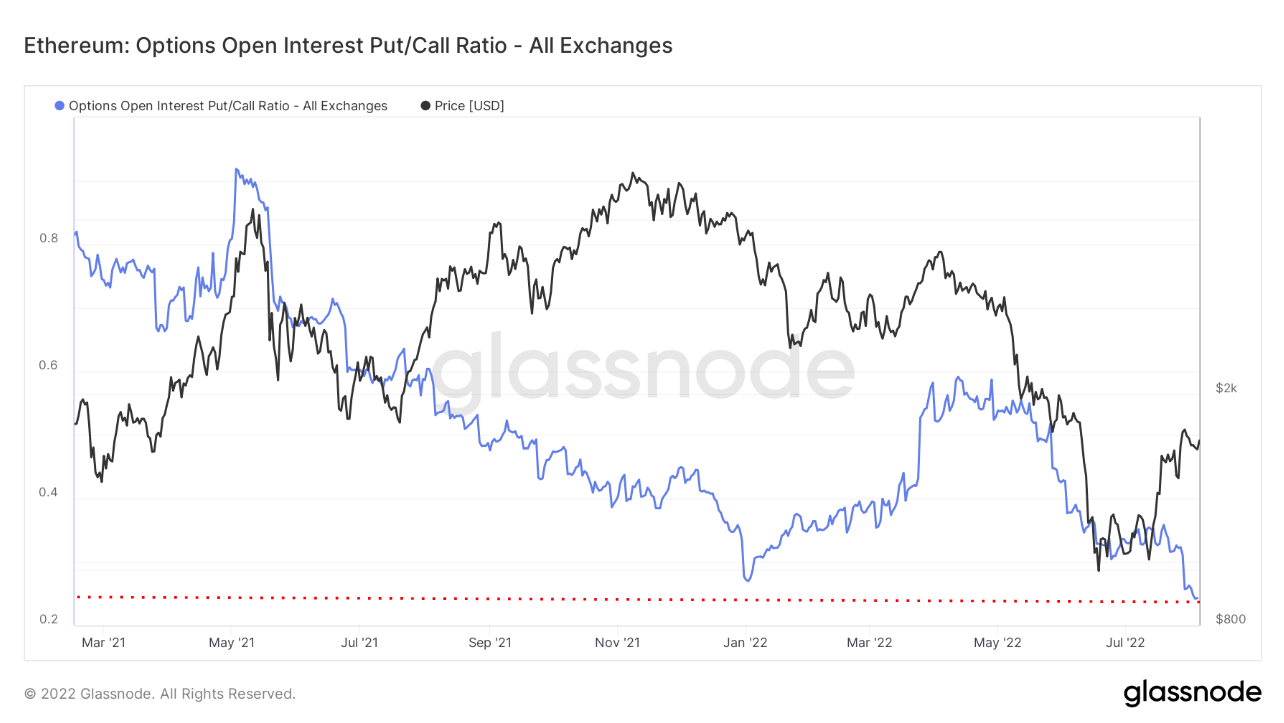
The options open interest put/call ratio also shows a speculator’s market. The indicator shows the put volume divided by the call volume of all funds currently allocated in options contracts to determine the overall mood of the market. A rising put/call ratio shows traders are speculating that the market will move lower and are buying more put options than call options. On the other hand, a falling put/call ratio shows a bullish sentiment as more traders are buying calls than puts.
Ethereum’s put/call ratio is currently the lowest it has ever been, and at 0.24 shows a huge number of traders are anticipating a bull run.


