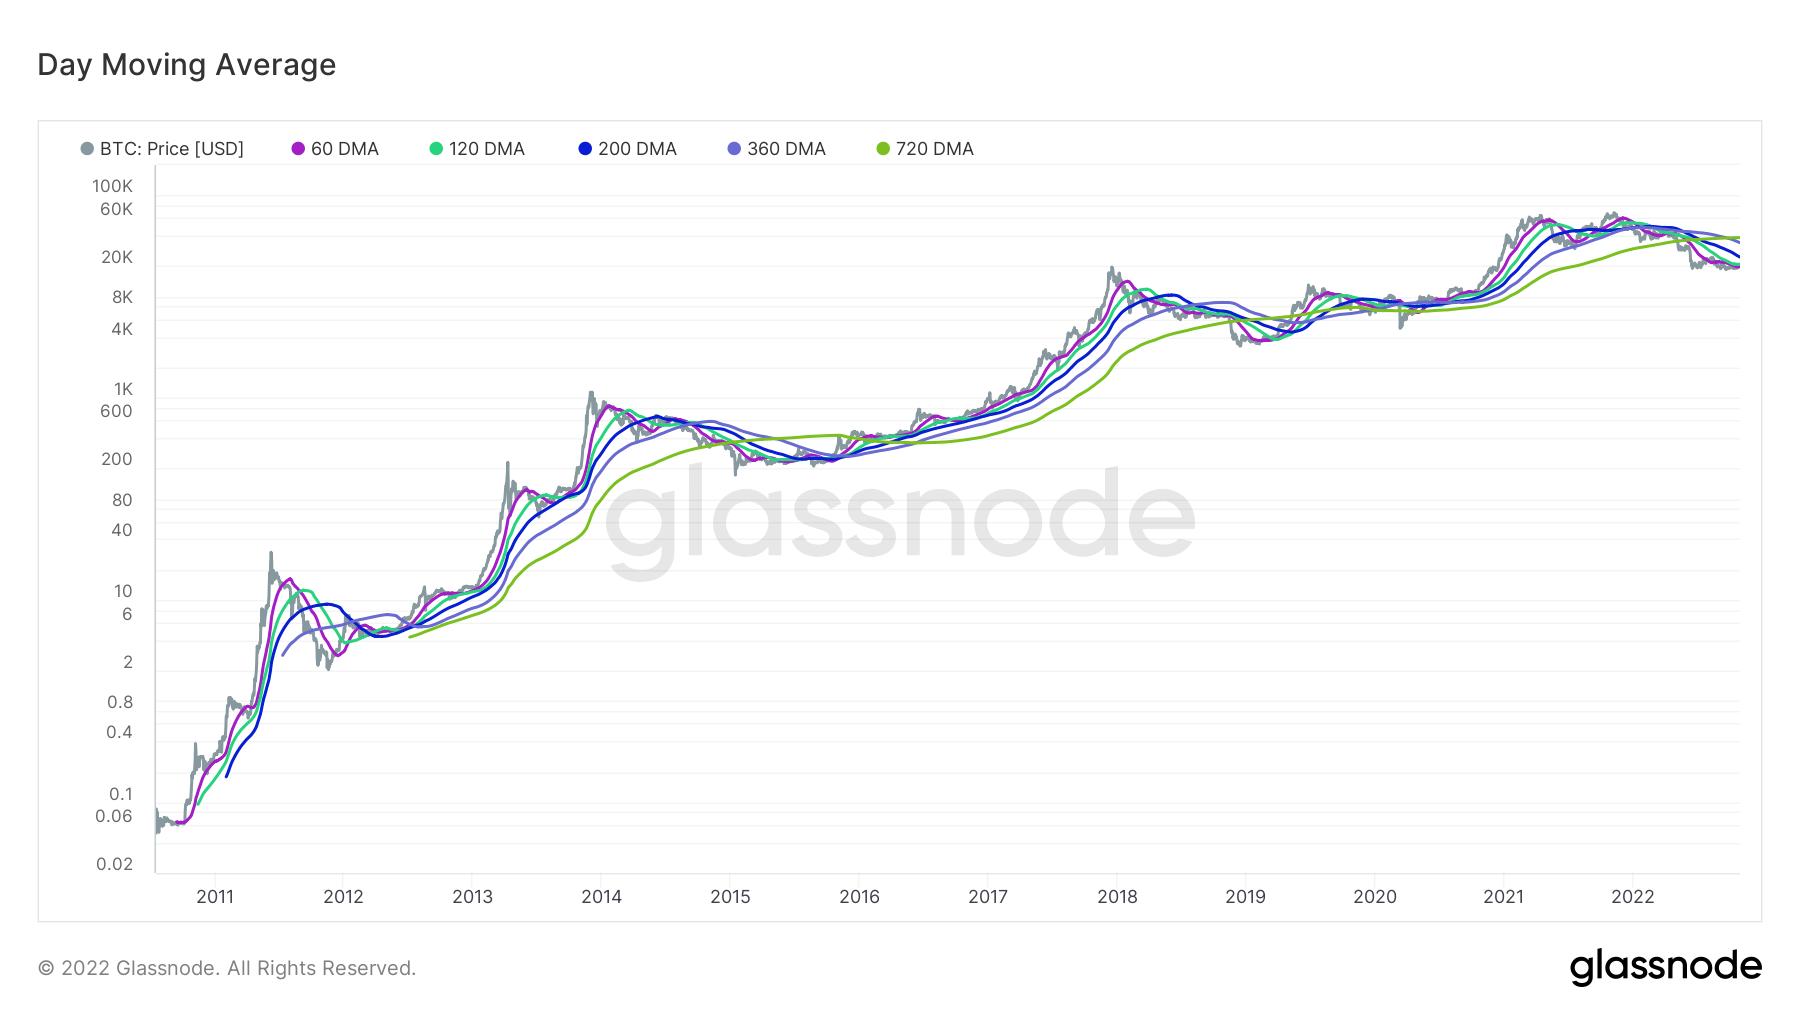
Last month, CryptoSlate reported that the price of Bitcoin fell below all five key medium to long-term moving averages for only the fifth time in its history.
Previous instances of this occurring resulted in a strong rally for BTC, leading to some technical analysts calling these events “a generational buy opportunity.”
Six weeks on from the original post, how is Bitcoin faring?
Bitcoin Moving Averages
Moving averages refer to a technical analysis indicator used to identify the trend direction of a particular crypto asset.
It is calculated by summing all the price data points during a specific period, then dividing the sum by the number of time periods. Any period can be used. However, five commonly used periods for assessing medium to long-term trends are the 60-day, 120-day, 200-day, 360-day, and 720-day.
As the data is plotted using past data, moving averages cannot be used in isolation as a trading signal. Rather they are often used in conjunction with other indicators to form an overall assessment of future trends.
The chart below shows that Bitcoin is still below the key moving averages except for the 60-day MA, with BTC crossing above this period on October 25.
Despite a sharp sell-off at 14:00 (UTC) on October 31, BTC remains above the 60-day MA, and the “generational buying” uptrend remains intact.

Zooming in
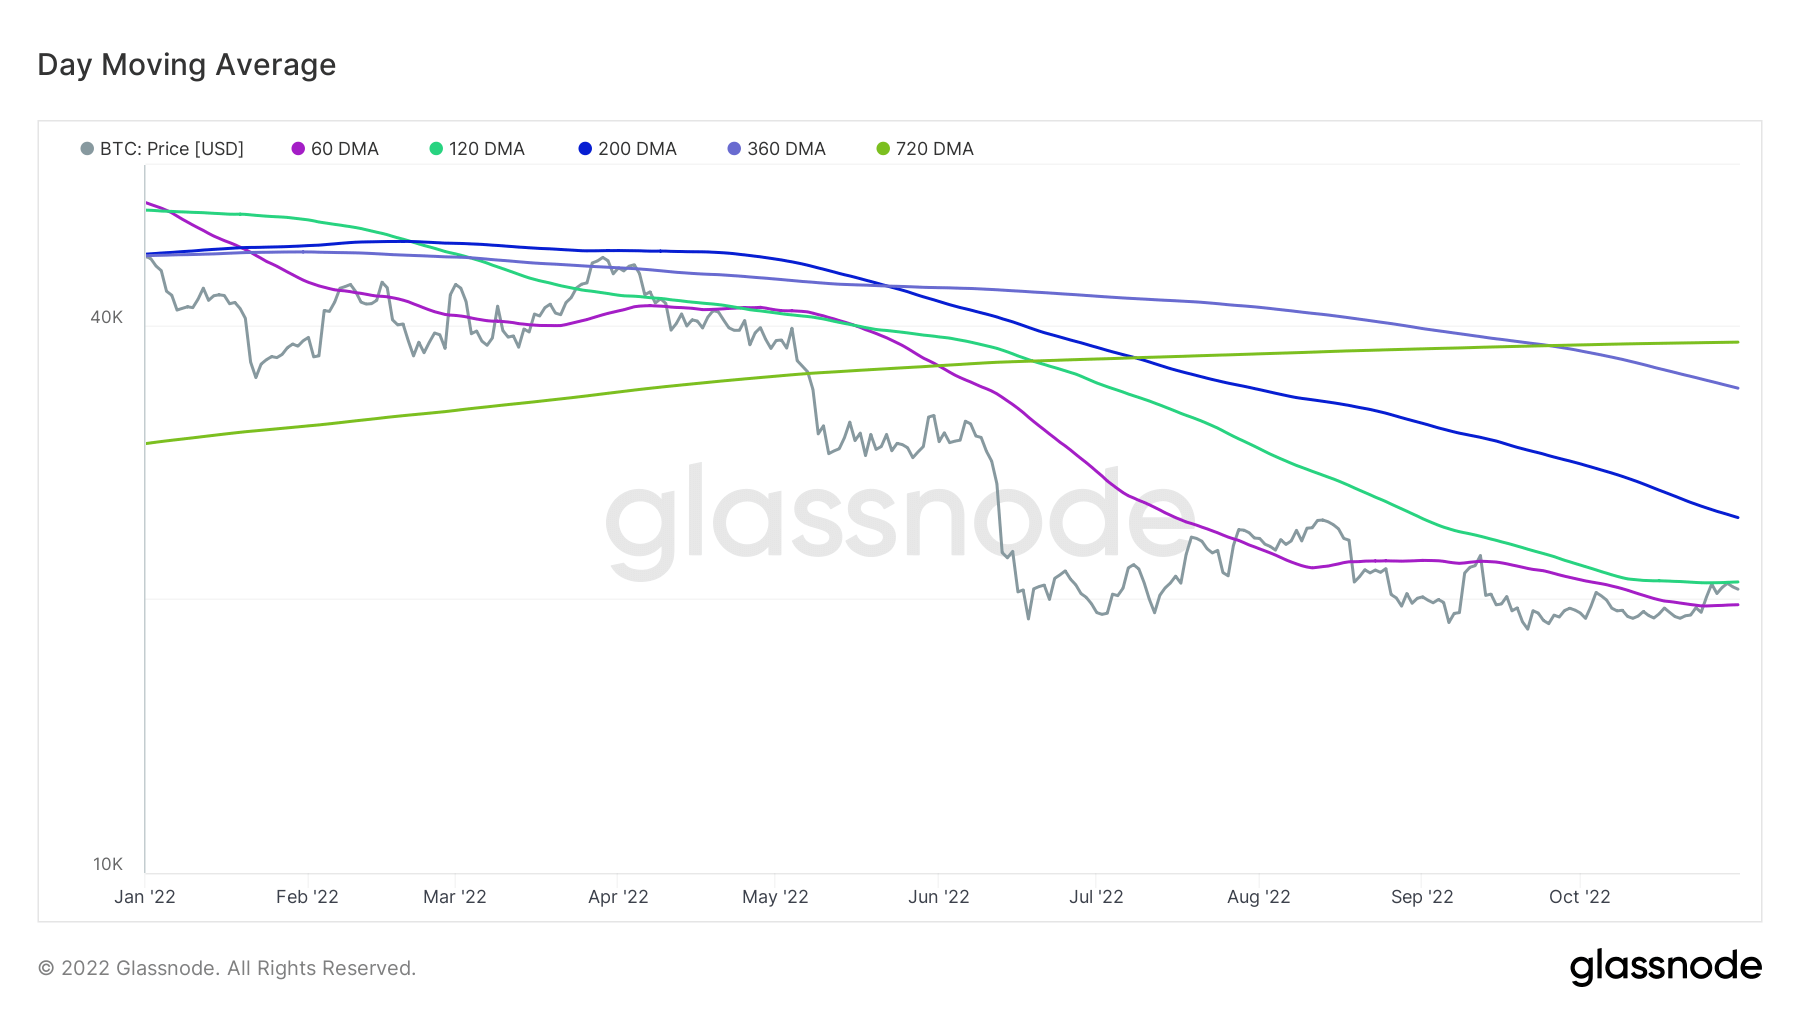
Analysis of the five key moving averages on a year-to-date timeline shows Bitcoin above the 60-day MA at present.
What’s more, since crossing above the 60-day MA, BTC has retested the 120-day MA on two occasions, being rejected both times. Bitcoin would need to build on a daily close above $20,900 to recapture this level.

Last week’s rally to $21,000 brought welcome relief and a renewed sense of optimism. However, Bitcoin’s failure to build on this for the next leg up has sentiment stuttering.
Combined with the ongoing macro uncertainty, it remains to be seen if the present plays out as a generational buying opportunity,


