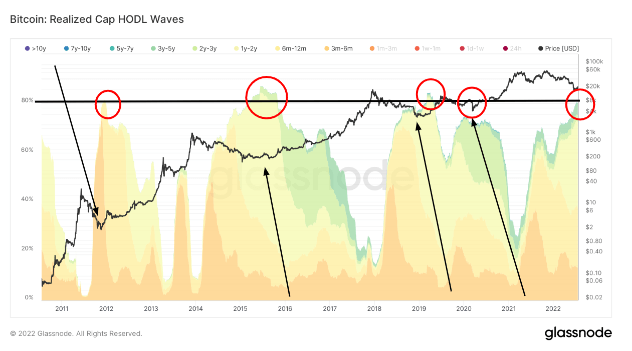
Numerous metrics could be used to determine cycle tops and bottoms but realized cap HOLD waves are rarely mentioned in the bunch.
Also referred to as HODL waves, the metric represents the bundle of all active supply age bands. In the chart below, each colored band shows the percentage of all circulating Bitcoin that was last moved within a certain time frame, weighted by its realized price.

Data from Glassnode has shown that 80% of Bitcoin’s circulating supply sits in the hands of long-term holders (LTHs). Defined as users that have owned Bitcoin for at least six months, LTHs are usually the ones forming strong support for Bitcoin’s market cycle bottoms.
LTHs are considered to be “smart money” in Bitcoin markets and are usually seen accumulating Bitcoin during suppressed markets. Once a bull market sets in, LTHs are the ones distributing the accumulated Bitcoin and taking most of the profits.
On-chain data strongly supports this theory. The chart above clearly shows that each time Bitcoin claimed a new all-time high (ATH), LTHs sold off their holdings. During every cycle bottom, LTHs are the hodlers of last resort, providing Bitcoin with strong support.
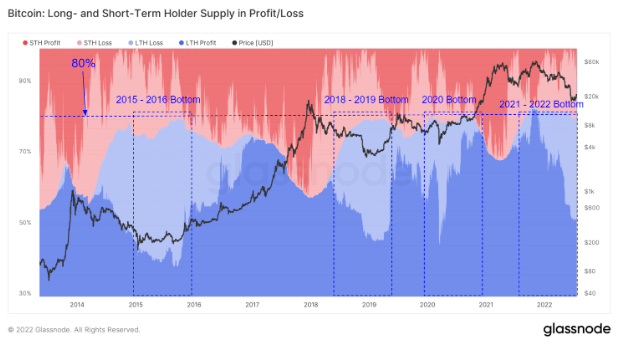
Glassnode’s analysis of long and short-term holder supply in profit and loss further supports this claim.
The chart below shows that 80% of Bitcoin’s supply lies in the hands of LTHs, which are marked blue. The remaining 20% of the supply is held by short-term holders (STHs) and is marked red. Overlapping the blue and red zones of the chart with Bitcoin’s price movements shows that LTHs saw almost no capitulation this market cycle — their holdings dropped from 82% to 80% of the supply.
The 2% decrease is considerably lower than what we’ve seen in previous cycles, showing that the market has been putting in lower highs. As these lower highs reinforce the strength of the network, LTHs seem to reinforce their belief in Bitcoin’s value. The bear market that began in May saw only a small percentage of Bitcoin’s supply move from LTHs to STHs, as LTHs saw it as an opportunity to either hodl or continue accumulating Bitcoin.
While the ongoing bear market looks eerily similar to all previous market cycle bottoms, it’s still too early to know if the industry’s about to head in a more bullish direction. However, if Bitcoin has reached this cycle’s bottom, we could expect a recovery in the coming weeks.


