[vc_row full_width=”stretch_row” css=”.vc_custom_1531732107238{background-color: #fcc118 !important;}”][vc_column]

[/vc_column][/vc_row][vc_row css=”.vc_custom_1531730959461{border-bottom-width: 1px !important;background-color: #f9fafb !important;border-bottom-color: #eef3f7 !important;border-bottom-style: solid !important;}”][vc_column css=”.vc_custom_1531891416301{margin-bottom: 0px !important;}”][bsfp-cryptocurrency style=”widget-6″ align=”auto” columns=”2″ scheme=”light” coins=”top-x-coins” coins-count=”8″ coins-selected=”” currency=”USD” title=”Cryptocurrencies” show_title=”0″ icon=”” heading_color=”” heading_style=”default” bs-show-desktop=”1″ bs-show-tablet=”1″ bs-show-phone=”1″ css=”.vc_custom_1531730265600{margin-bottom: 0px !important;}” custom-css-class=”” custom-id=””][/vc_column][/vc_row]

Solana soars 43% against Bitcoin so far in 2023

0

The L1 Native Token Returns vs. BTC highlights the relative price performance of large L1 native tokens versus bitcoin since Jan. 4.

Quick Take

  • Solana: +42.4% against BTC
  • BNB: -3.0% against BTC
  • DOT: +4.8% against BTC
  • ETH: +2.2% against BTC
  • Matic: +2.8% against BTC
Native Token Returns vs. BTC: (Source: Glassnode)

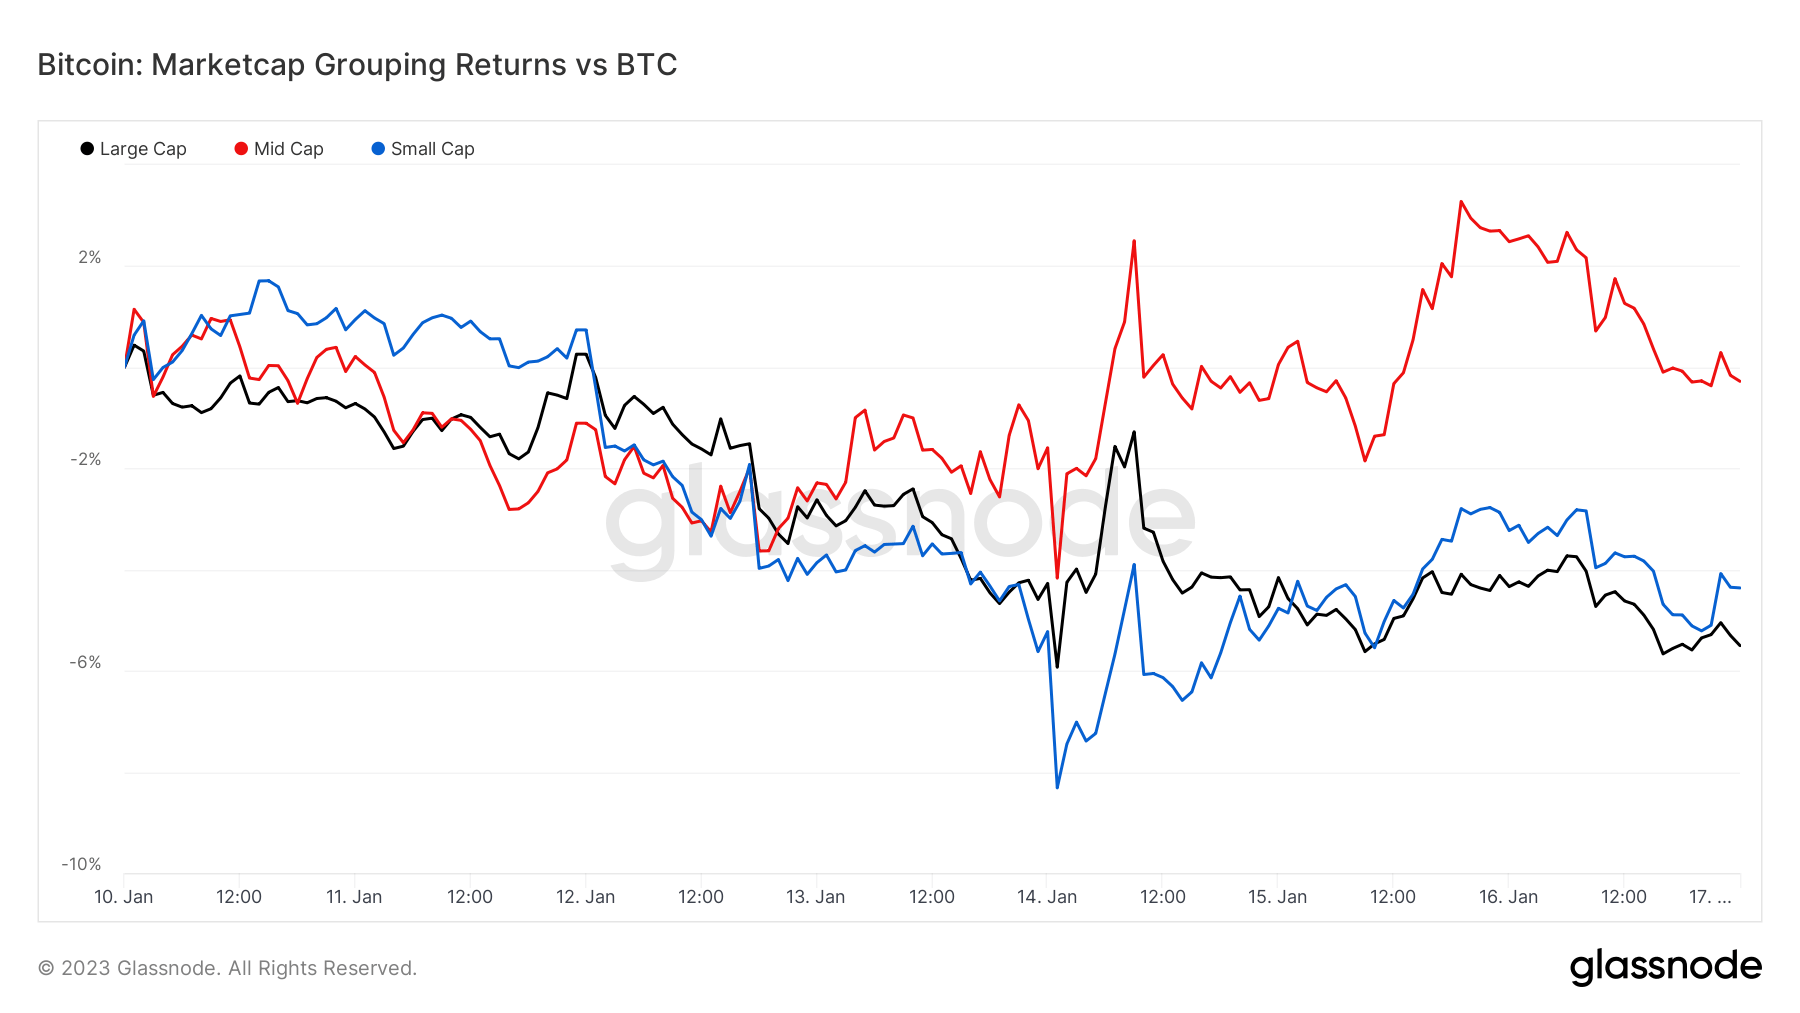
Definition: Market Capitalization Grouping vs. BTC

The Market Capitalization Grouping vs. BTC highlights the relative price performance of market capitalization size-based clusters versus bitcoin. Market capitalization groupings are defined as, Large Cap: >1B $, Mid Cap: 1B-100M $, Small Cap: 100M-50M $.

Quick Take

While in the last week since Jan. 10, large, mid, and small caps are all posting negative returns against Bitcoin.

  • Large Caps: -5.5%
  • Mid Cap: -0.27%
  • Small Cap: -4.36%
Marketcap grouping returns vs. BTC: (Source: Glassnode)

The post Solana soars 43% against Bitcoin so far in 2023 appeared first on CryptoSlate.

Leave A Reply

Your email address will not be published.