


Determining the length of an ongoing bear market is extremely difficult to do with a single metric, especially when looking at short time frames. To better understand an ongoing bear market, one must zoom out and consider how various market fundamentals functioned in previous cycles.
Often overlooked but solid market performance indicators are active addresses and entities. Active addresses represent the number of unique Bitcoin addresses that either sent or received a transaction. On the other hand, active entities are a cluster of addresses controlled by the same network entity that were active either as a sender or a receiver.
CryptoSlate used advanced heuristics and Glassnode’s proprietary clustering algorithms to estimate the number of active entities.
These two metrics are solid indicators to gauge whether the market has entered its bearish phase, showing how many users are interacting with the network.
Analyzing the relationship between Bitcoin’s price and the network’s active addresses and entities shows three distinct bear market cycles in the past five years — the first between 2018 and 2019, the second between 2019 and 2020, and the third between 2020 and 2021.
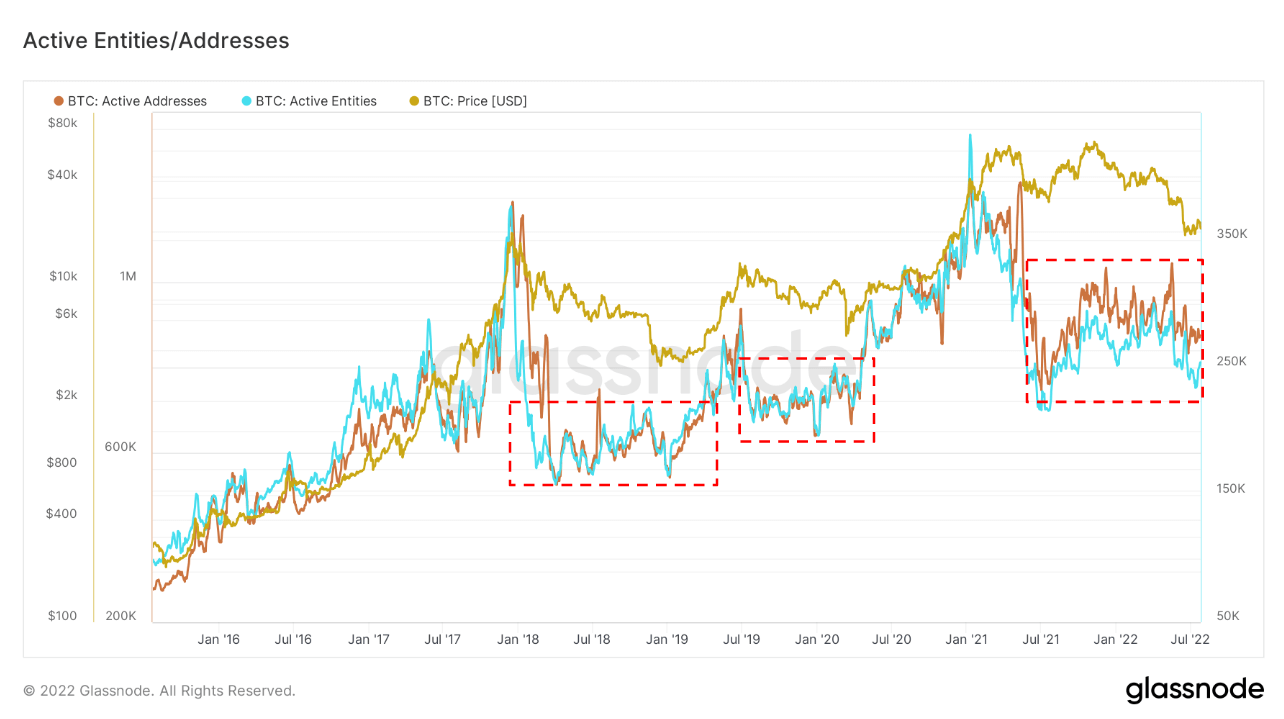
In 2017, the Bitcoin network had 1.19 million active addresses. In 2021, that number grew to 1.24 million, meaning that only 50,000 new active addresses were added to the network. While this might seem like a low number relative to the overall rise in Bitcoin adoption, it’s important to note that there were only 523,000 active addresses in the 2018 cycle. In the 2020 cycle, there were 640,000, while the 2021 cycle had 746,000 active addresses. A slight 4% uptick in on-chain activity was only seen during peak bull run events such as the ones we’ve seen in 2017 and 2020.
Analyzing Glassnode data reveals an interesting phenomenon in the market — each bear market creates a new high in the number of active addresses and entities. This shows that the users drawn in by the bull market are riding out the bear market and resuming their activity once conditions improve.
However, there hasn’t been a significant influx of new users in the current bear cycle. This suggests that we’ll continue seeing the continuation of this bear cycle until macro conditions change for the better.