“Fair value” is a term that’s not often used in the crypto market, but it’s one that can help investors position their trades to make the most out of the volatile market. Knowing a “fair value” of a crypto asset enables investors to know whether the asset is overvalued or undervalued at its current price.
The ratio that shows the difference between an asset’s market cap and realized cap is called the MVRV-Z Score. The score also shows the standard deviation of all historical market cap data.
Historically, the MVRV-Z Score has been used to mark tops and bottoms in Bitcoin market cycles with impressive reliability. A high MVRV-Z Score usually indicated a market top, while a low MVRV-Z Score showed a market bottom followed by an upturn.
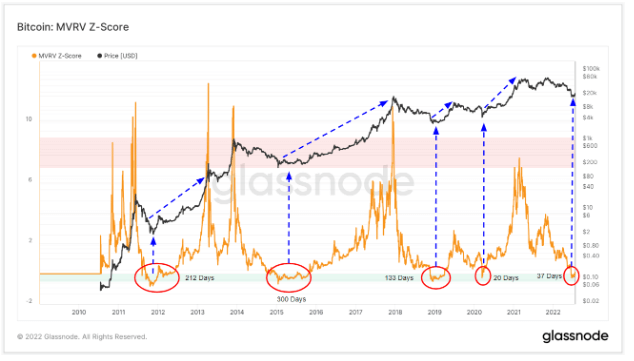
In the chart below, Bitcoin’s price perfectly correlates with market tops predicted by the MVRV-Z Score. Overheated market cycles pushed Bitcoin’s MVRV-Z Score deep into the red zone and have always resulted in an aggressive price slump. On the other hand, when the market value falls below the realized value, it has historically indicated a market bottom.
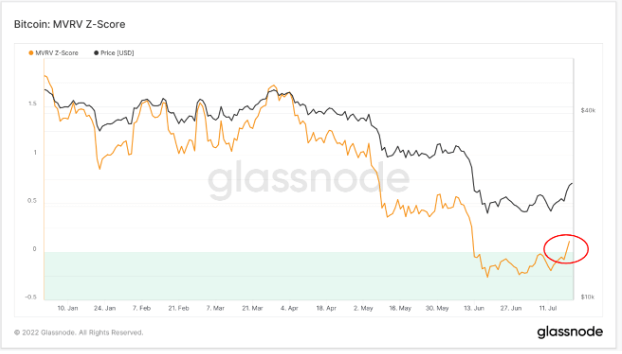
In June, the MVRV-Z Score dropped significantly and entered the “green zone,” a move that indicated a potential price bottom during this bear market.
According to Bitcoin’s previous MVRV-Z Scores, the last cycle bottom occurred in March 2020, when the onset of the COVID-19 pandemic set global markets spiraling down as investors rushed to cash out.
The MVRV Z-Score has correctly called the last four bear market bottoms. The chart above showed that the MVRV-Z Score spent 212 days in the green zone in 2012. In 2015, the MVRV-Z Score spent over 300 days in the green zone. In 2019, the low MVRV-Z Score lasted for 133 days, while 2020 saw it spend only 20 days in the green zone. The green zone on the MVRV Z-Score chart shows when Bitcoin is “undervalued.”
Still, the MVRV-Z Score isn’t foolproof.
The ratio can’t predict how long an asset will remain undervalued or overvalued and shows no discernible repeating pattern. How long the score spends in the green or red zones can also vary significantly, as the ratio doesn’t consider macroeconomic factors that affect price movements.
Take, for example, the global market crash in March 2020. Caused by the onset of aggressive economic measures to combat the COVID-19 pandemic, the crash wiped out trillions from the global economy, decimating the crypto market. Bitcoin’s MVRV-Z Score experienced a sharp drop at the time, indicating that the asset was significantly undervalued. However, it stayed undervalued for only 20 days, as a massive portion of stimulus checks provided by central banks worldwide went directly into the crypto market, most notably Bitcoin.
After spending 37 days in the “green zone,” Bitcoin’s MVRV-Z Score increased and showed the asset was no longer undervalued. While this could indicate a revival of the market’s bullish sentiment, investors should remain cautious, as this isn’t the first time Bitcoin’s MVRV-Z Score briefly exited the green zone.
Until the global macro sentiment changes and demand for Bitcoin returns to its pre-crash levels, Bitcoin can continue to fall in and out of the “unvervalued” category.